

Putting COVID on Trial -- Part 1
Putting COVID on Trial -- Part 1
Two Competing Narratives

People like UK COVID modeler, Neil Ferguson (and US health bureaucrat, Anthony Fauci) face different incentives than the rest of us do. Some of the incentives that they face may be perverse incentives, leading them to outright lie to the public about what the science says about things.
But accusations of intentional dishonesty — or even dishonesty engaged in under duress caused by unidentified, ulterior actors threatening the bureaucrats — would need to be followed up on in a hearing, because it is judicial to allow for the case to be made on both sides in all conflict resolutions.
The idea of talking about the merits of the case — where conflict resolutions are settled using logic, rather than violence — is what allows for peaceful society to move forward without violence.
Imperial College London model
Notorious COVID modeler, Neil Ferguson, said, in March of 2020, that UK deaths from COVID could later hit 500,000 — peaking out at over 200 daily deaths per million, adding that strict interventions could cut the deaths in half though.
But did daily deaths per million ever even reach a tenth of 200 daily deaths per million? No:
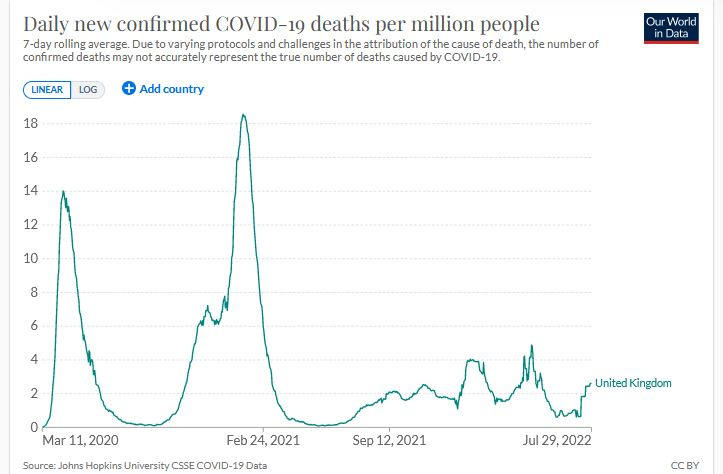
In the UK, daily deaths per million only ever reached 18 — not even one-tenth of what was projected by a computer model with computer code which was never released 100%, without any redactions.
How about ICU needs? He also said that ICU bed use could reach approximately 3000 in ICU per million, but that strict interventions could cut the ICU bed use by two-thirds.
Was there ever a time when the number in ICU per million even reached a tenth of 3000 in ICU per million? No.

In the UK, ICU bed use never reached beyond about 60 in ICU per million — 50 times lower than what was predicted.
US Health Bureaucrats no better than the UK ones
Without data to back it up, Anthony Fauci is on record stating that COVID is something like 10 times more deadly than flu. The worst recent flu on record, now that CDC went 3 years back in time and changed the numbers for the 2017/18 flu season, is the 2014/15 flu season, when the infection fatality rate (IFR) was 0.143%.
Using the 7 seasons from 2012/13 to 2018/19, the median flu IFR is still 0.11%. If COVID ever really WAS 10 times worse than that, it’d mean the COVID IFR was 1.1%. But it’d be hard to keep your reputation as an expert if robust evidence can show that COVID was never even twice as fatal as the severe flu of 2014/15.
Almost in an effort to save face, Neil Ferguson worked as part of a team and came to Fauci’s rescue with a scientific report apparently showing that the lowest recorded COVID IFR in several nations was 0.47%, with many nations having COVID IFR values above 1.1%.
If what these “experts” have been saying — something which you could call the “Fauci/Ferguson Narrative” — had been the actual truth, then it’d come close to explaining how over a million excess deaths have occurred in the USA during “COVID.”
It’d also come close to explaining how major news media outlets have each been running more than 12 unique COVID stories per calendar day (more than one new COVID story per major media outlet, every 2 hours, nonstop).
The Evidence
But early evidence existed which pointed away from the claims of the Fauci/Ferguson Narrative, as has been heavily-propagated through Big Tech and Legacy Media.
The outbreak on the Diamond Princess cruise ship led to peak passenger infections on 7 Feb 2020 (29 new passenger infections) with the final passenger infection found on 15 Feb 2020.
These dates of passenger infections are important, because only passengers died and, on April Fool’s Day (1 Apr 2020) — 46 days after the very last passenger infection — the World Health Organization had 7 total COVID deaths in their Situation Report #72.
Onset-to-death time-course data show that 99% of all COVID deaths that are ever seen are seen by Day 50 after symptom onset, making the WHO update on 17 Apr 2020 — where they supposedly had found a new tally of 13 total deaths from Diamond Princess infections — absurd.
The chance of obtaining a sample of deaths with 46% of the sample found during such a late time-frame that less than 1% of the deaths were ever expected to be found that late, is 0.000 000 001 616.
There’s not even 2 chances in a billion that that WHO Situation Report on 17 Apr 2020 is “legitimate” and that 6 people infected more than 50 days prior had all recently died.
In a court of law, WHO officials could still argue: “But there STILL IS 1.6 chances in a billion that we are telling the truth about 6 of 13 people dying after Day 50!” — but the jury would likely laugh at that.
Logic of Infection Fatality Rate (IFR) estimates
IFR estimates have a hard lower bound to them, but not a hard upper bound. Let’s use an analogy to a ruler — where different kinds of rulers might give estimates above or below the true length of 12 inches.

If someone said that rulers can be off by more than 12 inches, would you believe them? It is actually possible for a manufactured “12-inch ruler” to be off by more than 12 inches, but it is only possible for the ruler to be THAT far off in one, single direction (e.g., a yardstick, mistaken for a 12-inch ruler).
To be off by THAT much, it has to be a ruler that is “too large.”
Rulers cannot ever be more than 12-inches too small though. There is a hard lower bound on the error of estimation when using a 12-inch ruler, though there is no hard and limiting upper bound on the error of estimation.
In a similar way, the lower IFR estimates which are found are more likely to be correct than any of the higher IFR estimates which are reported in the scientific literature.
While you can create situations where the COVID-infected die at higher rates than the true IFR (e.g., withhold promising medical care from them), you cannot create situations where the COVID-infected die at “lower rates” than the true IFR.
The true IFR incorporates medical best practices, showing you only the inherent lethality of the disease, itself.
While higher IFR estimates are possible to achieve, as when you withold promising medical treatments from infected people, those estimates are all likely “wrong estimates” (because of the inherent one-sidedness to IFR estimation).
Diamond Princess Data
By April 2020, a good estimate of COVID fatality could be made for elderly people (all Diamond Princess deaths were in the elderly) — strongly indicating that the Wuhan-1 (wild-type) strain of COVID was less than twice as bad as flu.
Really good estimates are ones with really high confidence associated with them, and there is even a benchmark about what it is that constitutes “really high confidence.”
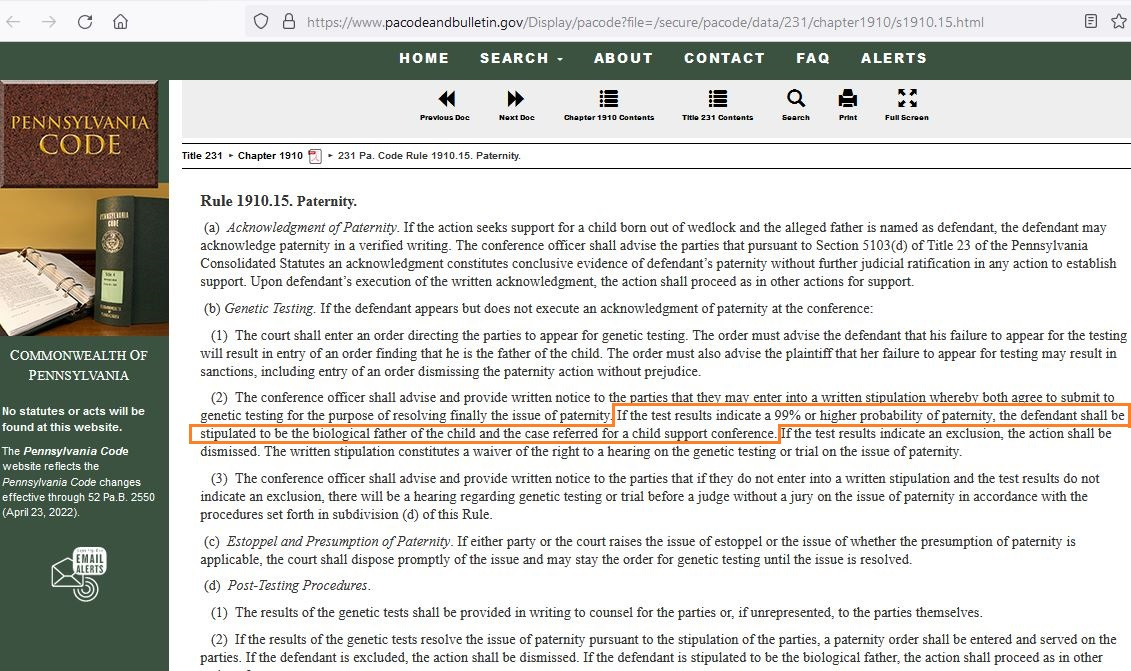
In courts of law, paternity cases can be decided by reference to DNA testing, as long as there is a really high probability for the defendent (putative biological father) to be the father. Here is the law code in the state of Pennsylvania, showing that 99% probability is high enough to settle a court case:
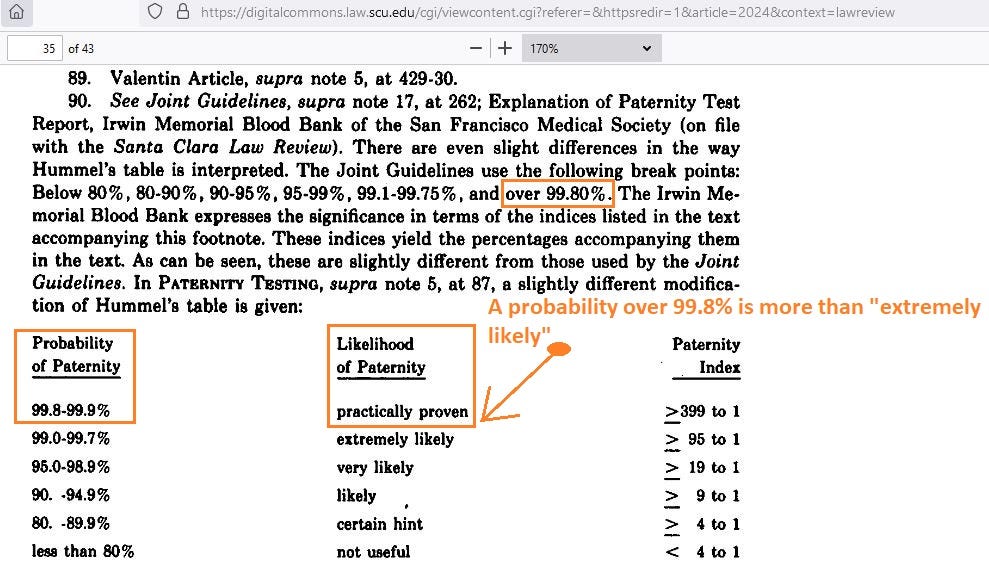
But, if you are really diligent, you can extend confidence even beyond 99%, to 99.9%, where there is very little doubt that your estimate is wrong. Here is a screenshot showing the kinds of “verbal predicates” associated with such high probability:
In order to go even a step beyond the level of evidence required to settle cases of law, I created a 99.99% credible interval around estimates of COVID IFRs in order to capture the entire limit of plausibility on what can be expected to be true of the world.
Note on Credible Intervals versus Confidence Intervals
The Bayesian credible intervals that are used below are “better than” traditional confidence intervals, in that they have the advantage of being able to show the actual probability that the one, true parameter value is inside — whereas confidence intervals are merely formed by a process which successfully captures the true parameter value a certain percentage of the time.
95% of all 95% confidence intervals “work” — meaning that 95% of them successfully capture the true value. But 100% of all 95% credible intervals “work” — meaning that, after forming even just one of them, you have already found the probability of containing the true value.
The elderly IFR for flu is about 0.9% (almost 1 in every 100 elderly people infected with flu end up dying from it), so that particular point is marked off in the graph below, which shows the relative probability on the entire range of elderly IFRs for COVID:

Using R (statistics software) on early Diamond Princess data, I discovered that all elderly COVID IFR estimates above 4.3% are all implausible, due to being inconsistent with, or “contradicting,” known elderly death data from the Diamond Princess cruise ship.
====================
Note: Unlike the modelers at Imperial College London, I am willing to share all the R code used in order to obtain the actual probability on all COVID IFR estimates, given known data. It does not require a lot of code to get really good answers on this research question.
====================
The vertical lines are bounds on a 99% credible interval around the elderly IFR for wild-type (Wuhan-1) COVID, and the elderly IFR for flu is contained within those bounds.
While researchers may have “reported” COVID IFRs in the elderly as being above 4.3%, good science requires that your theory or your estimation process does not contradict any of the known evidence. But being above the upper bound on a 99.99% credible interval is tantamount to a “contradiction.”
It could have been scientifically known by April 2020 that wild-type COVID wasn’t likely even twice as bad as flu for the elderly — and that it was “definitely” (to 99.99% confidence) not 5 times as bad as flu, let alone 10 times as bad as flu, as the Fauci/Ferguson Narrative would have you believe.
====================
Caveat: The possibility remains open that those on the cruise ship were “special” in some way and, after strongly indicating so, future researchers would then have some rational justification for reporting IFR estimates above 4.3% — even knowing that IFR estimates are only lower-bounded things. Without first justifying a difference, future researchers reporting higher IFR estimates would be “contradicting” known data.
====================
In future parts, the evolution of COVID variants, along with the limits of plausibility which can be applied to the variant-specific IFR estimates, will tell us if it is plausible for COVID to be the cause of a million US deaths — or if it is not even scientifically plausible (even at the outer limits of plausibility) for COVID to be the cause of even a third of those deaths.
Reference
[17 Mar 2020 new story on Imperial College London model showing up to 3000 per million in ICU] — COVID-19: Imperial researchers model likely impact of public health measures. Dr Sabine L. van Elsland, Ryan O'Hare. https://www.imperial.ac.uk/news/196234/covid-19-imperial-researchers-model-likely-impact/
[2 Apr 2020 report in Nature on Imperial College London model showing a peak of over 200 daily deaths per million] — Special report: The simulations driving the world’s response to COVID-19. How epidemiologists rushed to model the coronavirus pandemic. David Adam. https://www.nature.com/articles/d41586-020-01003-6
[11 Mar 2020 congressional hearing where Fauci said COVID IFR is 10x worse than flu] — Reason. COVID-19 Mortality Rate 'Ten Times Worse' Than Seasonal Flu, Says Dr. Anthony Fauci. Ronald Bailey. https://reason.com/2020/03/11/covid-19-mortality-rate-ten-times-worse-than-seasonal-flu-says-dr-anthony-fauci/
[19 May 2022 report in Nature showing COVID IFR estimates all above 0.46%] — Brazeau, N.F., Verity, R., Jenks, S. et al. Estimating the COVID-19 infection fatality ratio accounting for seroreversion using statistical modelling. Commun Med 2, 54 (2022). https://doi.org/10.1038/s43856-022-00106-7
[online news outlets each producing 22 new COVID news stories per day] — Krawczyk K, Chelkowski T, Laydon DJ, Mishra S, Xifara D, Gibert B, Flaxman S, Mellan T, Schwämmle V, Röttger R, Hadsund JT, Bhatt S. Quantifying Online News Media Coverage of the COVID-19 Pandemic: Text Mining Study and Resource. J Med Internet Res. 2021 Jun 2;23(6):e28253. doi: 10.2196/28253. Erratum in: J Med Internet Res. 2021 Jul 14;23(7):e31544. PMID: 33900934; PMCID: PMC8174556. https://www.ncbi.nlm.nih.gov/pmc/articles/PMC8174556/
[top news media outlets each producing 15 new COVID news stories per day] — News media coverage of COVID-19 public health and policy information. 28 Sep 2021. https://www.nature.com/articles/s41599-021-00900-z
[Pennsylvania Code, Rule 1910.15, subsection b2: "If the test results indicate a 99% or higher probability, the defendant shall be stipulated to be the biological father ..." ] — Rule 1910.15. Paternity. Available: https://www.pacodeandbulletin.gov/Display/pacode?file=/secure/pacode/data/231/chapter1910/s1910.15.html
[99.9% probability is already high enough — i.e., is already “proof enough” — to settle court paternity cases] — Santa Clara Law Review. Volume 22 | Number 3 Article 2. A Few Things You Should Know About Paternity Tests (But Were Afraid to Ask). 1 Jan 1982. Robert W. Peterson. https://digitalcommons.law.scu.edu/cgi/viewcontent.cgi?httpsredir=1&article=2024&context=lawreview
[Diamond Princess breakdown of cases by age] — National Institute of Infectious Diseases in Japan. Available from: https://www.niid.go.jp/niid/en/2019-ncov-e/9417-covid-dp-fe-02.html
[Diamond Princess final evacuation report detailing 696 total confirmed infections] — Anan H, Kondo H, Takeuchi I, Nakamori T, Ikeda Y, Akasaka O, Koido Y. Medical Transport for 769 COVID-19 Patients on a Cruise Ship by Japan Disaster Medical Assistance Team. Disaster Med Public Health Prep. 2020 Dec;14(6):e47-e50. doi: 10.1017/dmp.2020.187. Epub 2020 Jun 5. PMID: 32498735; PMCID: PMC7298096. https://www.ncbi.nlm.nih.gov/pmc/articles/PMC7298096/
[WHO COVID-19 Situation Report #72 on 1 Apr 2020 showing 7 Diamond Princess deaths 46 days after all passenger infections had occurred] — WHO. https://www.who.int/docs/default-source/coronaviruse/situation-reports/20200401-sitrep-72-covid-19.pdf
[WHO COVID-19 Situation Report #88 on 17 Apr 2020 showing 13 Diamond Princess deaths] — WHO. https://www.who.int/docs/default-source/coronaviruse/situation-reports/20200417-sitrep-88-covid-191b6cccd94f8b4f219377bff55719a6ed.pdf
[“Time-to-death” probability for COVID; using the 95% upper bound of both the mean and the SD of the lognormal model which had fit the actual deaths best] — Linton NM, Kobayashi T, Yang Y, et al. Incubation Period and Other Epidemiological Characteristics of 2019 Novel Coronavirus Infections with Right Truncation: A Statistical Analysis of Publicly Available Case Data. Journal of Clinical Medicine. 2020 Feb;9(2). DOI: 10.3390/jcm9020538. PMID: 32079150; PMCID: PMC7074197. https://www.ncbi.nlm.nih.gov/pmc/articles/PMC7074197/
[Past seasons CDC reports of symptomatic flu infections and flu deaths by age] — CDC. https://www.cdc.gov/flu/about/burden/index.html
[16% of all flu infections remain asymptomatic; 84% of them progress to symptoms] — Leung NH, Xu C, Ip DK, Cowling BJ. Review Article: The Fraction of Influenza Virus Infections That Are Asymptomatic: A Systematic Review and Meta-analysis. Epidemiology. 2015 Nov;26(6):862-72. doi: 10.1097/EDE.0000000000000340. PMID: 26133025; PMCID: PMC4586318. https://www.ncbi.nlm.nih.gov/pmc/articles/PMC4586318/