After almost a thousand hours of research, patterns emerge. Truisms. Here’s a table showing how much excess death is excessive, when considering the time-window:
Yearly: 5%
Seasonally (winter): 10%
Monthly: 15%
Weekly: 20%
Any excess death numbers beyond those are excessive excess death numbers.
Weeks
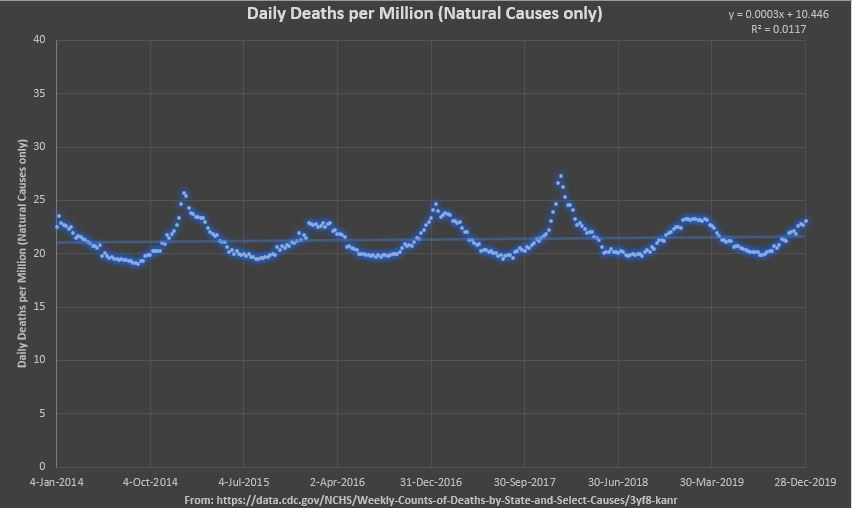
Most deaths are natural cause deaths, such as from diseases. Here’s a chart of 313 weeks of deaths by natural cause, put into units of 7-day average daily deaths per million:
[click image to enlarge it]
When deaths are by natural causes, then they only move around a little — according to the season. Average daily natural cause death per million in the USA can span from about 18 up to about 27, depending on the specific week (and the specific year) you look at.
Non-natural cause deaths are the result of some kind of a human choice, such as suicides and murders. When put together with the natural-cause deaths, you get all-cause deaths.
Weekly all-cause deaths have a standard deviation of approximately 6.5%, so that any singular weekly excess that is a 20% excess is a full 3 standard deviations above the mean. That’s why it’d be considered “excessive” if there were ever any weeks with 20% excess death in them.
It is something which would not happen by chance any more frequently than about once in every six years of observation. That’s one singular week of 20% excess death per six-year time interval — when it results solely from the play of chance.
Months
From the same source as in the graph above, the standard deviation in monthly death is about 4.5%, meaning that any single monthly excess of 15% would represent more than 3 standard deviations above the mean.
Because of the longer time-window, you will not see monthly excess death reach 15% by chance any more often than about once in every 28 years. It can happen twice in your adult lifetime, but not more often than that — you’d have to spend almost 90 years as an adult to see it happen three times in your life.
Seasons (Winter)
Excess Winter Mortality (EWM), in its simple form, is just the average death for the 4 months from December to March, compared to the other 8 months of a 12-month cycle (4 months prior to December; 4 months after March).
England and Wales are places with a lot of EWM, at least partly due to poor guidance from the UK government regarding vitamin D (e.g., D sufficiency was claimed whenever active vitamin D was 25 nmol/l).
When England & Wales were studied for 10 years, the maximum EWM found for all-cause excess winter death was 11% for those of age 15 to 44 and 18% for those of age 65 to 74.
The worst year in one of the worst places for EWM serves as a good stopping point: you shouldn’t become worse than “the worst of the worst.” While that’s a bit of hyperbole (England isn’t really “the worst” place for EWM), the main point is that 4-month average excess death rates should not be at or over 10%.
Years
The standard deviation of yearly death is 1.7%, meaning that 3 standard deviations above the mean would be 5.1%. You won’t see a yearly excess death count that is 5.1% excess by chance any more often than about once in every 300 years.
In other words, if not born at the right time, then you will never see yearly excess death counts reach 5.1% in your entire lifetime.
Importance: The above limits are important because recent excess deaths have reached double-digits, even on a yearly basis. It’s important for people to realize how rarely that something like that happens by chance.
Reference
[weekly and monthly death counts for 313 weeks of observation] — Weekly Counts of Deaths by State and Select Causes, 2014-2019. https://data.cdc.gov/NCHS/Weekly-Counts-of-Deaths-by-State-and-Select-Causes/3yf8-kanr
[2016 UK guidelines still recommended a paltry 25 nmol/L of active vitamin D as sufficient] — Scientific Advisory Committee on Nutrition (SACN). 2016. Vitamin D and Health. https://assets.publishing.service.gov.uk/government/uploads/system/uploads/attachment_data/file/537616/SACN_Vitamin_D_and_Health_report.pdf
[Excess winter death in the UK (Table 2)] — Jones RP. Excess Winter Mortality (EWM) as a Dynamic Forensic Tool: Where, When, Which Conditions, Gender, Ethnicity and Age. Int J Environ Res Public Health. 2021 Feb 23;18(4):2161. doi: 10.3390/ijerph18042161. PMID: 33672133; PMCID: PMC7926905. https://www.ncbi.nlm.nih.gov/pmc/articles/PMC7926905/
[yearly death has a standard deviation of 1.7%] — Ruhm CJ. Excess deaths in the United States during the first year of COVID-19. Prev Med. 2022 Sep;162:107174. doi: 10.1016/j.ypmed.2022.107174. Epub 2022 Jul 22. PMID: 35878708; PMCID: PMC9304075. https://www.ncbi.nlm.nih.gov/pmc/articles/PMC9304075/


