
Recent Excess Death Cannot be Omicron
Spain and Israel as examples

A recent Denmark study reported 30-day infection fatality by age group for Omicron variant, but only about 91% of COVID deaths occur by Day 30, so I adjusted their 30-day infection fatality rate (IFR) in order to account for the full IFR by age group.
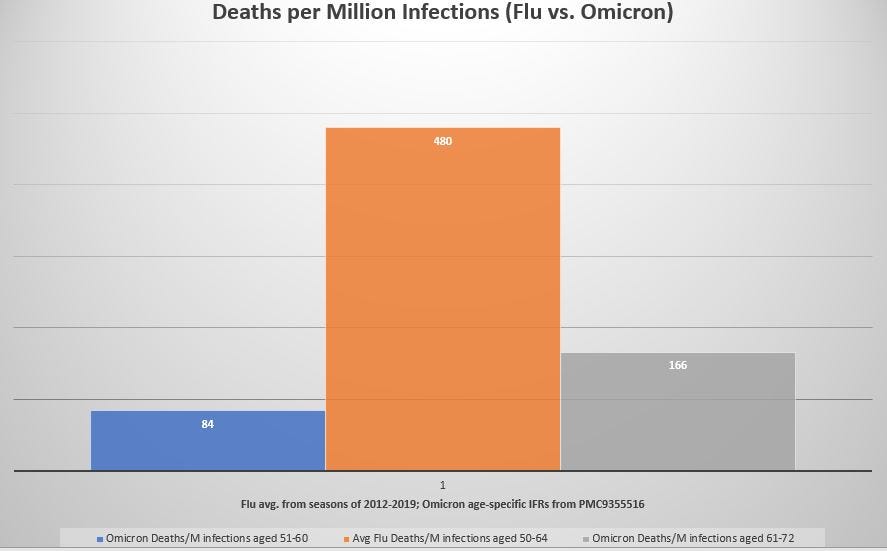
Compared to the average of 7 recent flu seasons, the age-specific Omicron IFR is much lower than the flu:
[click on the image above to enlarge it]
The middle column (orange) is the expected number of deaths from a million flu infections among those in the age bracket of 50-64. At left (blue) is the expected number of deaths from a million Omicron infections in the age bracket of 51-60.
At right (gray) is the expected number of deaths from a million Omicron infections in the age bracket of 61-72 — an age bracket even older than that used for the flu.
But if Omicron is not even a third as deadly as is seasonal flu, recent excess deaths around the world cannot be explained.
Spain
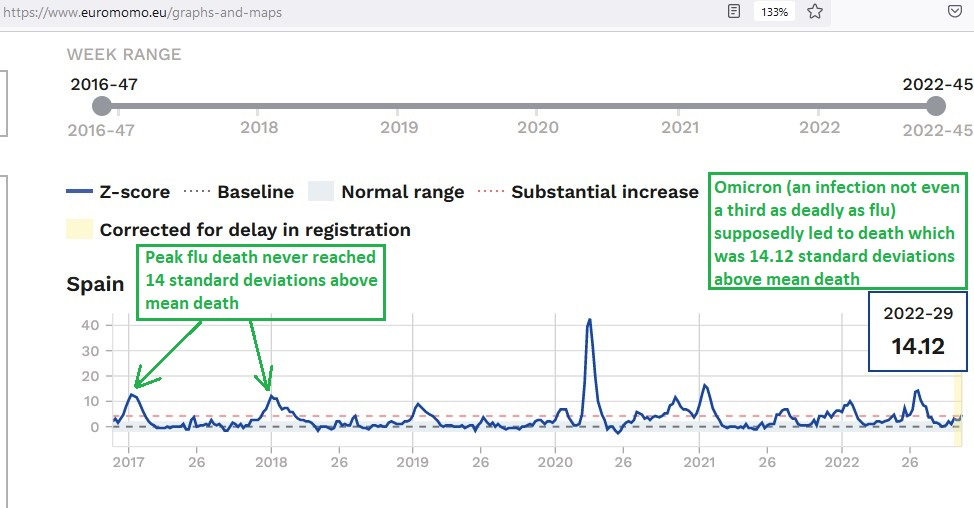
Spain had one of the highest levels of use of face-masks under COVID, and also had one of the highest relative increases in death under COVID during Week 29 of 2022 (peak at far right in the chart):
[click image to enlarge it]
The peak in the middle is crazy enough — i.e., a weekly death count which was over 40 standard deviations above the mean weekly death count. The severe flu of 2017/18 at left provides vital perspective.
But the peak at far right is inexplicable. It’s higher than during the severe flu of 2017/18, yet Omicron is not even a third as deadly as average flu, let alone severe flu.
Israel
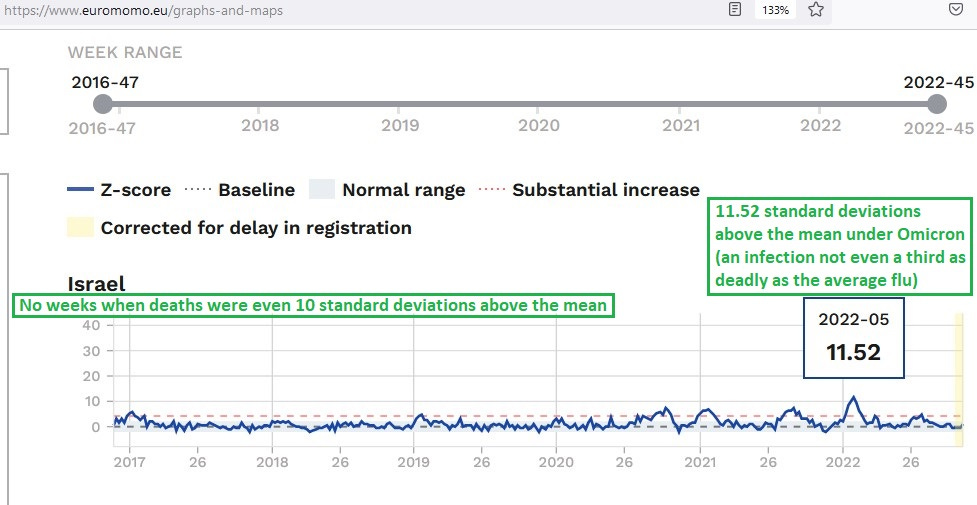
Israel logged its highest-ever relative excess death in weeks when Omicron was predominant (in Week 5 of 2022):
[click image to enlarge it]
These unexplainable excesses of death are most likely explained by the COVID injections. The disease, itself, is not lethal enough to cause this much excess death.
This means that there should be a halting of the administration of COVID jabs, because there are only “non-disease” explanations of excesses in death (during such a mild COVID variant).
Deep Stats
To get the IFR for flu from CDC’s Burden of Flu page, you have to adjust the total number of symptomatic cases upwards, to account for asymptomatic flu infections. This adjustment was made using an estimate from a systematic review of the proportion of flu infections which remain asymptomatic.
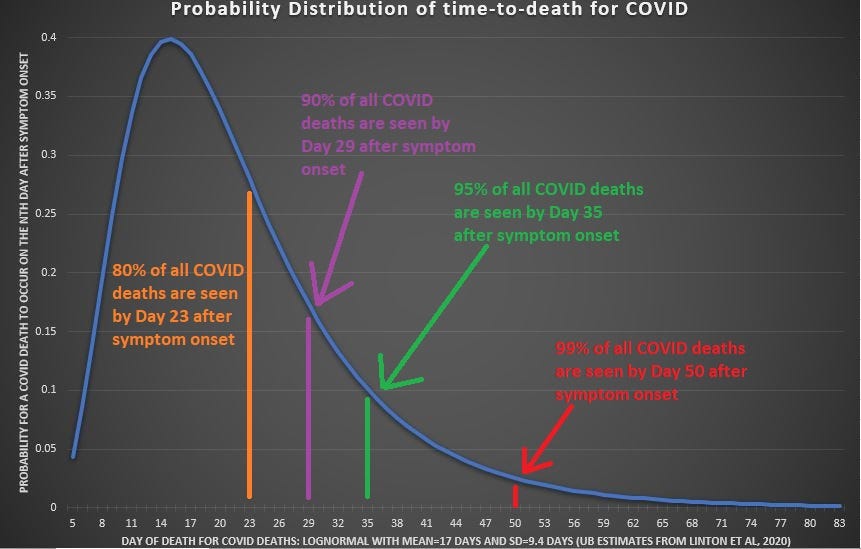
To get the full IFR for Omicron based on only the fatality rate going out to 30 days, you have to adjust the total expected death count upwards, to account for deaths which occur beyond 30 days.
This adjustment was made using an estimate from a “time-to-death” analysis. Here is a depiction of the distribution of deaths after infection:
[click image to enlarge it]
Reference
[Past seasons CDC reports of symptomatic flu infections and flu deaths by age] — CDC. https://www.cdc.gov/flu/about/burden/index.html
[16% of all flu infections remain asymptomatic; 84% of them progress to symptoms] — Leung NH, Xu C, Ip DK, Cowling BJ. Review Article: The Fraction of Influenza Virus Infections That Are Asymptomatic: A Systematic Review and Meta-analysis. Epidemiology. 2015 Nov;26(6):862-72. doi: 10.1097/EDE.0000000000000340. PMID: 26133025; PMCID: PMC4586318. https://www.ncbi.nlm.nih.gov/pmc/articles/PMC4586318/
[Omicron infections are much more numerous than PCR tests pick up, making the IFR lower than previously estimated] — Erikstrup C, Laksafoss AD, Gladov J, Kaspersen KA, Mikkelsen S, Hindhede L, Boldsen JK, Jørgensen SW, Ethelberg S, Holm DK, Bruun MT, Nissen J, Schwinn M, Brodersen T, Mikkelsen C, Sækmose SG, Sørensen E, Harritshøj LH, Aagaard B, Dinh KM, Busch MP, Jørgensen CS, Krause TG, Ullum H, Ostrowski SR, Espenhain L, Pedersen OBV. Seroprevalence and infection fatality rate of the SARS-CoV-2 Omicron variant in Denmark: A nationwide serosurveillance study. Lancet Reg Health Eur. 2022 Oct;21:100479. doi: 10.1016/j.lanepe.2022.100479. Epub 2022 Aug 5. PMID: 35959415; PMCID: PMC9355516. https://www.ncbi.nlm.nih.gov/pmc/articles/PMC9355516/
[Relative Excess Weekly death in Europe] — EuroMOMO. https://www.euromomo.eu/graphs-and-maps
[“Time-to-death” model for COVID; using the 95% UB of both the mean and SD of the lognormal model that fit the actual deaths best] — Linton NM, Kobayashi T, Yang Y, et al. Incubation Period and Other Epidemiological Characteristics of 2019 Novel Coronavirus Infections with Right Truncation: A Statistical Analysis of Publicly Available Case Data. Journal of Clinical Medicine. 2020 Feb;9(2). DOI: 10.3390/jcm9020538. PMID: 32079150; PMCID: PMC7074197. https://www.ncbi.nlm.nih.gov/pmc/articles/PMC7074197/