

Relative Poverty kept people safe from COVID
Relative Poverty kept people safe from COVID
Possible link to level of health care provision?

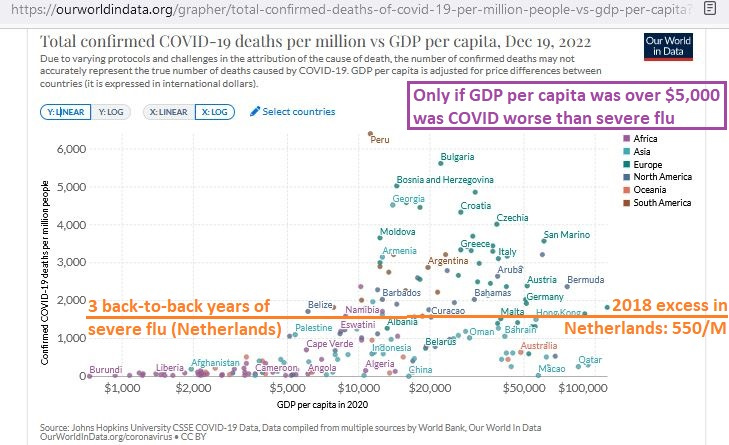
In 2018 in The Netherlands, there was severe flu and it led to 9,373 excess deaths when the mid-season population of The Netherlands was 17.18 million — which is approximately 550 excess deaths per million for that year.
Using that excess death rate as a standard for severe respiratory disease, you can evaluate the excess deaths, or the COVID deaths, over the last 3 years:
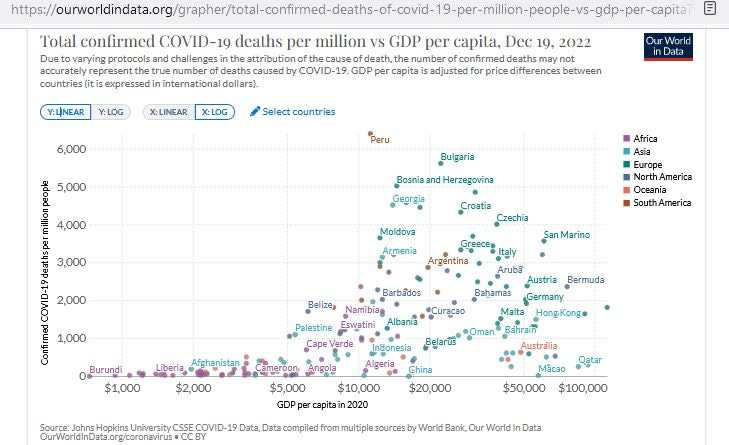
The GDP per capita across the bottom is in log scale, so that GDP doublings have approximately the same distance between them. Notice how it was that your nation needed to have over $10,000 in GDP per capita for COVID to be able to kill an accumulated total of 2,000 per million over the entire 3 years.
Here’s how the same graph looks when the excess death in 2018 in The Netherlands is overlayed:
[click image to enlarge]
A disturbing thought is that a certain level of health care provision — not attained by the poor countries — was required to increase COVID deaths beyond that seen with severe flu.
There are over 40 nations both above and below the cutoff, and yet no instances of high COVID death when the nation-of-interest was poor. Having more than 40 in each sample adds statistical power to the results.
Reference
[In 2018 in The Netherlands, excess deaths associated with flu were 9,373 when the mid-season population was 17.18 million; which is equivalent to 546 yearly excess deaths per million (YEDpM)] — van Asten L, Harmsen CN, Stoeldraijer L, Klinkenberg D, Teirlinck AC, de Lange MMA, Meijer A, van de Kassteele J, van Gageldonk-Lafeber AB, van den Hof S, van der Hoek W. Excess Deaths during Influenza and Coronavirus Disease and Infection-Fatality Rate for Severe Acute Respiratory Syndrome Coronavirus 2, the Netherlands. Emerg Infect Dis. 2021 Feb;27(2):411-420. doi: 10.3201/eid2702.202999. Epub 2021 Jan 4. PMID: 33395381; PMCID: PMC7853586. https://www.ncbi.nlm.nih.gov/pmc/articles/PMC7853586/