

Amanda Bartolotta over at World Net Daily (WND) has been doing an awesome job proving that Great Replacement Theory isn’t just a theory: It’s happening. But being science-minded, replication is important. If a claim is made, you would want to see if you can replicate it with clear sourcing of solid data. First let’s use solid job data.
Solid job data is hard to find because you can finagle numbers and tweak them to make it look like good job growth is occurring — at least to the casual observer. But to know if job growth is occurring — to really know that it is — do not look at headline numbers. Instead, look at hours worked. In 2022, there were 259.9 billion hours worked:
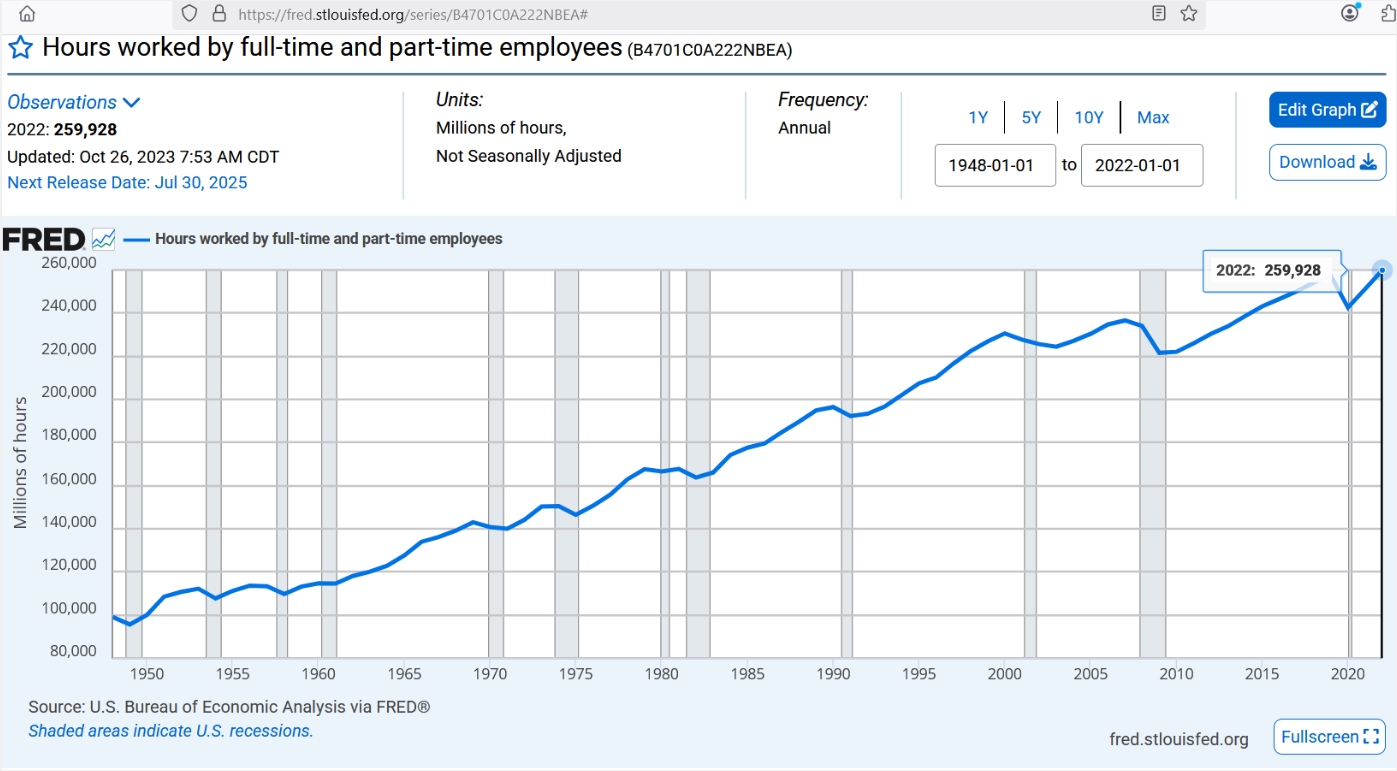
To turn those hours into a number of “full-time equivalent” workers, you could set a standard for what counts as “full-time annual hours worked” and then divide it by that standard. Other research reveals that a good number to use is 1837.3 hours per year for full-time workers, which ends up being about 35.3 hours per week on average.
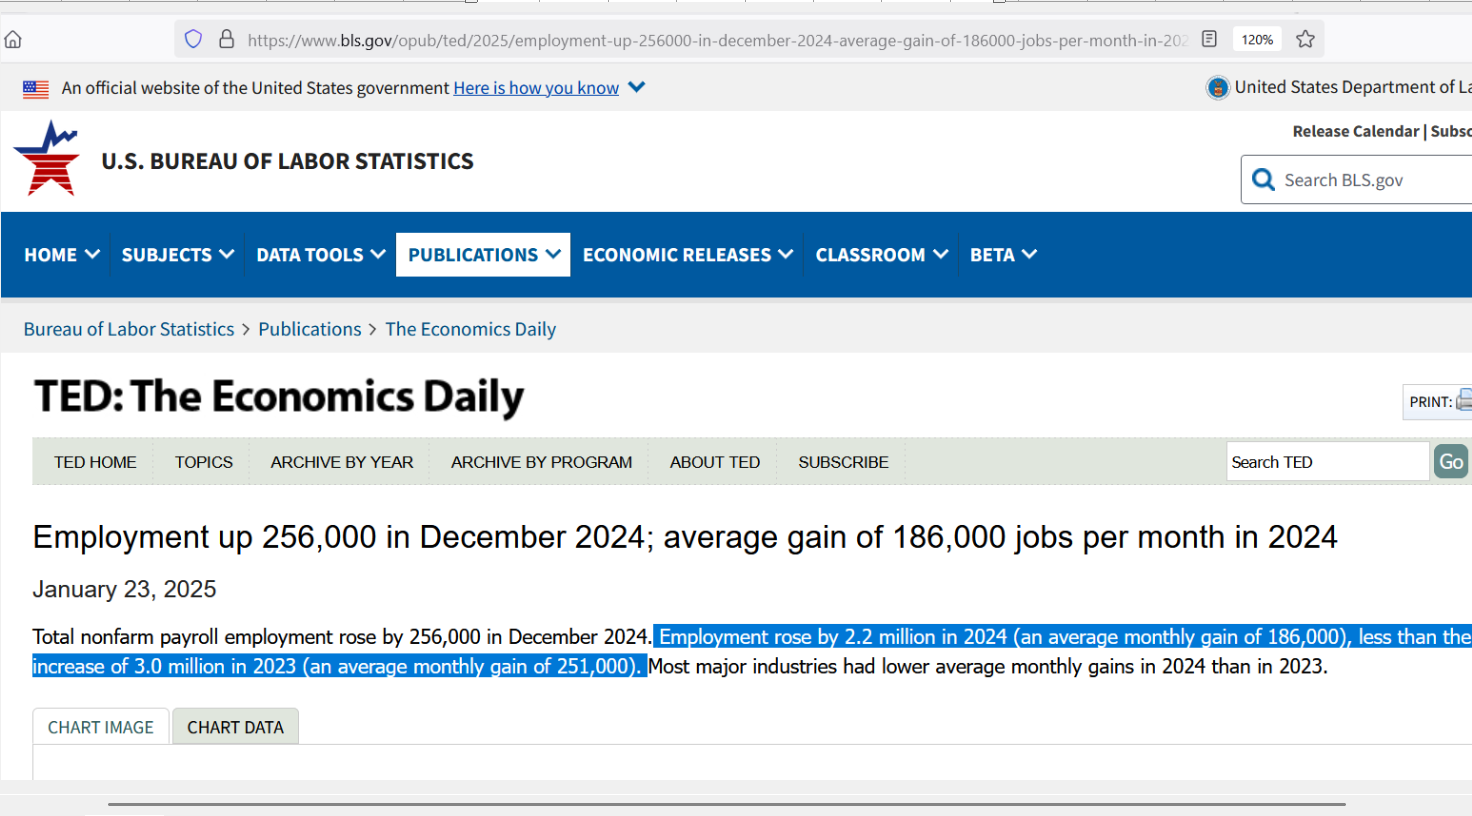
Note that, at 40 hours a week for 52 weeks, you would divide by 2080 hours instead of by 1837.3 hours — so 1837.3 hours is a conservative figure and if used consistently, will not introduce bias. The Bureau of Labor Statistics (BLS) claims that 3 million jobs were created in 2023:
But a good question to ask is:
Did full-time equivalent hours rise by 3 million?
Remember, we’re just dividing by a constant number every time, using hours to estimate jobs. The reason to do this is because, if everyone with full-time work was knocked down to part-time, we’d get much less income, but employment numbers would stay the same (the employment numbers would not truthfully indicate our loss of work).
Using 1837.3 yearly hours to represent full-time equivalent work — along with the total hours worked in the chart above — reveals that, in 2022, there were 141,472,813 full-time equivalent workers in the USA (a total amount of work that would be able to employ 141.5 million persons full-time).
If what BLS claimed is true (that we gained 3 million jobs), then the hours worked would grow 2.12%. A great question to ask regarding that would be:
Did the hours grow by that much?
Unfortunately, the chart at top only goes to 2022, so we’ll use other data series to look for the 2.12% growth which is required in order for that bold BLS claim to be true. Two estimates were found, and here was the lowest one:
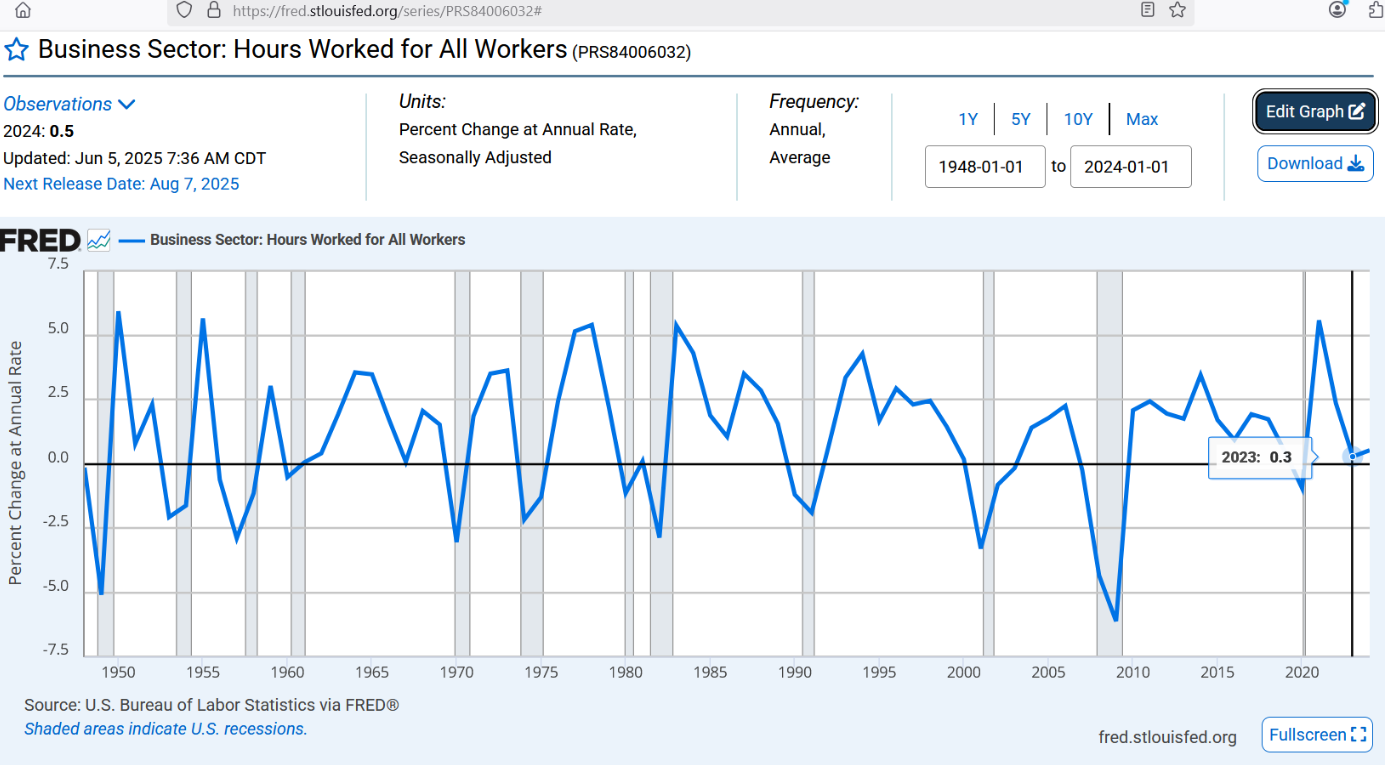
According to this estimate (also from BLS!), the growth in the hours worked for 2023 was only 0.3% — which contradicts their original claim that we added 3 million jobs. If full-time workers got fired and then, instead, worked two different part-time jobs, then BLS might not be “lying” (because the number of held jobs would be higher).
But we’d be no better off. Remember, from a baseline of 141.5 million full-time equivalent workers, to add 3 million requires that you bump up the total hours up by 2.12%. The second estimate (also from the BLS!) is somewhat higher, but it still does not exonerate the BLS for deceptively sugar-coating the job numbers:
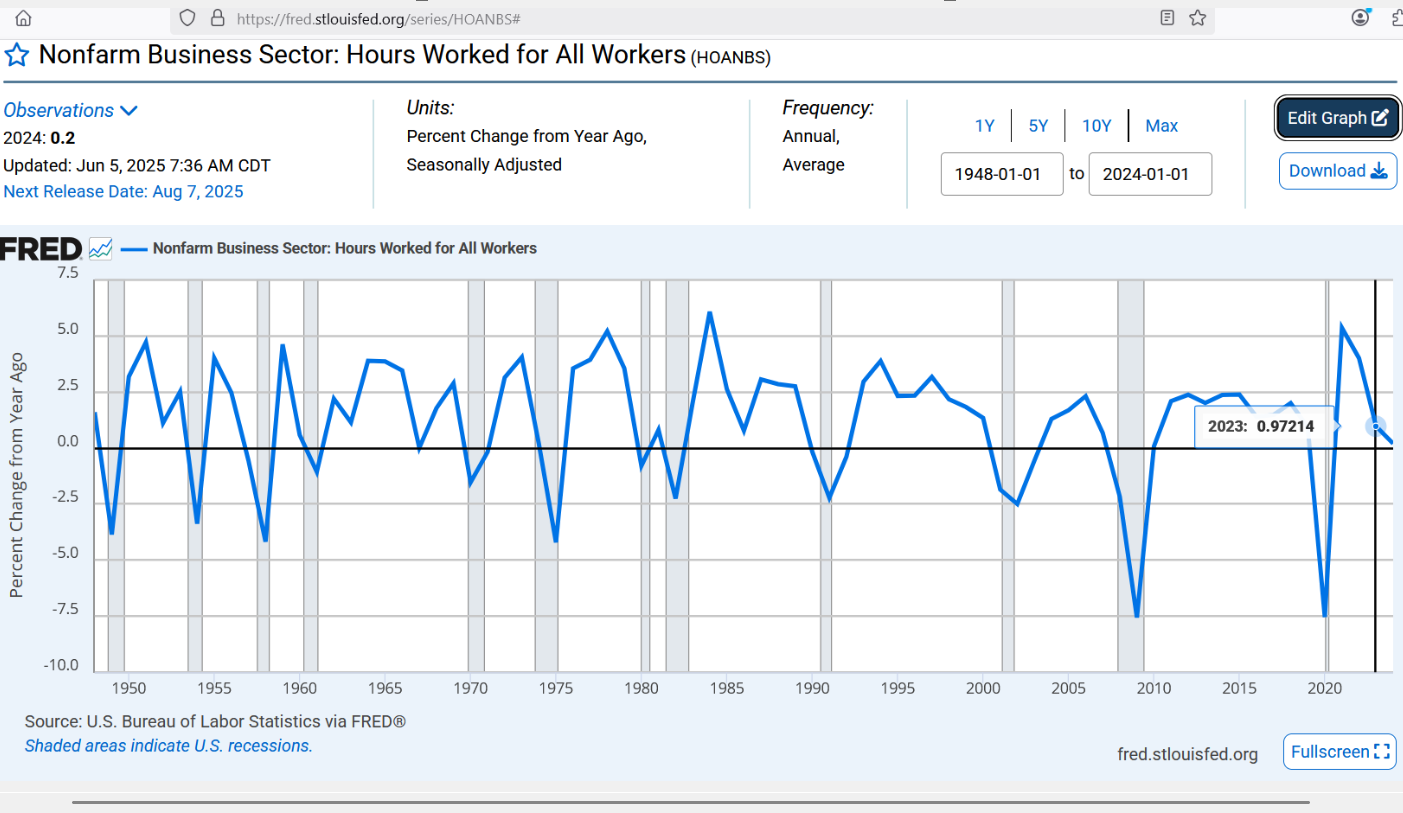
In this estimate of the change in the total number of hours worked, we have a 0.97% increase, which is essentially a 1% increase — not even half of the way to exonerating the BLS for the claim that it made about 2023 job growth. It looks like BLS was playing “fast-and-loose” with the numbers when they reported 3 million new jobs in 2023.
In 2023, total hours worked did not increase any more than 1% from the year prior (job totals in 2023, using standard hours of work, were no more than 1% higher than 2022). This higher estimate of the increase in hours worked reveals that only 1.4 million new “full-time equivalent” jobs got created in 2023 (less than half of what BLS claimed).
Getting back to what Amanda Bartolotta was demonstrating — i.e., that Americans are being replaced by foreigners in the U.S. workforce — we can ask about the government approvals of “employment authorizations for foreign nationals” which she cited in her original article. For fiscal year 2023, it looks like 3.4 million of them:
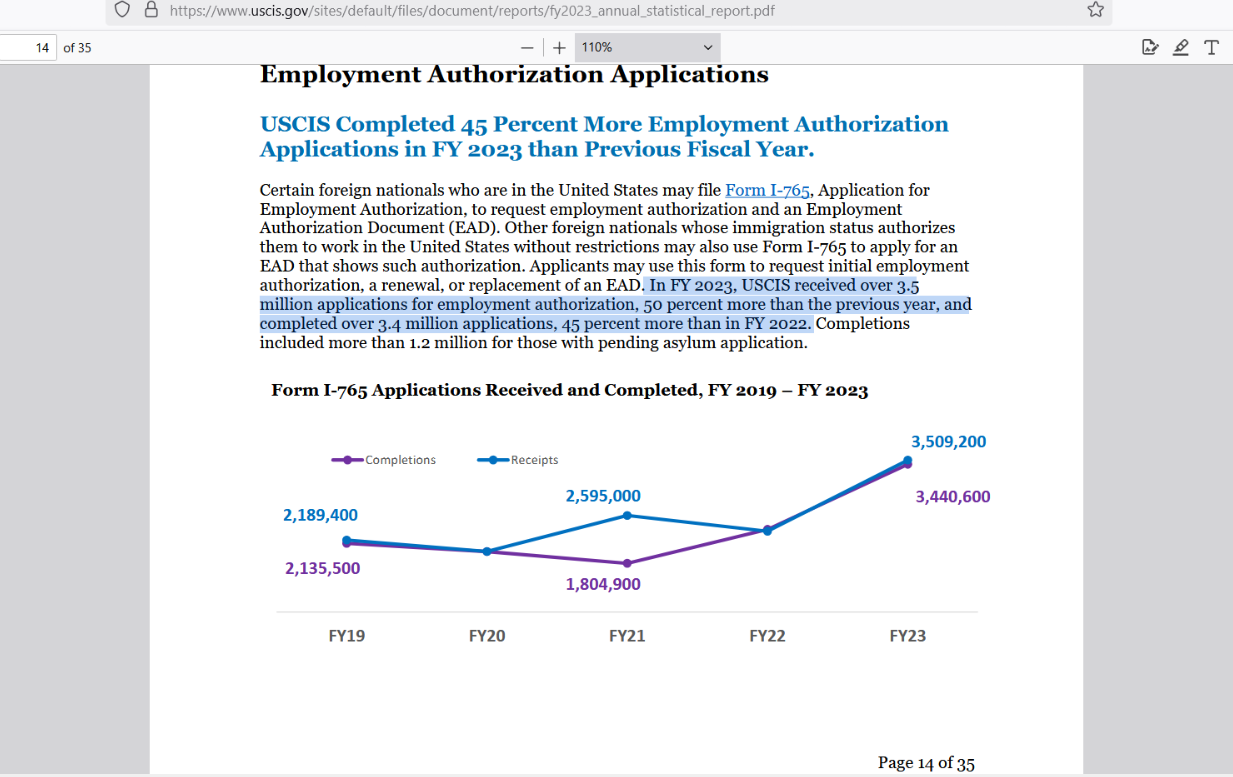
But if 3.4 million foreign nationals got approved to work in the USA during a year when job growth was only 1.4 million, then that means that twice as many foreign workers are entering the U.S. job market than the grand total of newly-created U.S. jobs. In other words, if 41% of them got jobs, it would mean they took all 1.4 million new jobs.
If 41% of the foreign nationals got those 1.4 million jobs created in 2023, then it means that the job growth for American citizens would have been “zero” for 2023 (assuming that 41 out of every 100 of those 3.4 million took jobs). Notice how even the original claim by BLS of 3 million new jobs could still mean all jobs going to foreign nationals.
This would have meant that 88% of those foreign nationals — whose applications to work in the USA had been one of the 3.4 million applications that went through — really did find a job (88% of 3.4 million = 3.0 million). If 100% of them had found a job, then it would require 0.4 million American citizens to lose their job (“job stealing”).
When poor economic policy in the USA has led to job growth only increasing by 1% or less per year**, then it doesn’t make good sense to have what is the equivalent of “200% of all new jobs” worth of foreign applications for U.S. work coming in. It makes it extremely hard for American citizens to find a job.
The evidence suggests that "Great Replacement Theory” isn’t just a theory: it is happening. We haven’t even been creating enough jobs for the foreigners whose applications have gone through, let alone for any American citizens who need work. In fact, there are two foreign nationals acquiring work approval for each job created.
As an aspect of the Great Reset, Great Replacment Theory amounts to a violation of sovereignty, and efforts should be made in order to undermine Great Replacement Theory. Globalist elites might want Americans to remain out of a job, while the domestic jobs go to people from other countries, but we should push back on this.
**Under 1% Annual Job Growth from 2019 to 2022
Hours worked in 2019
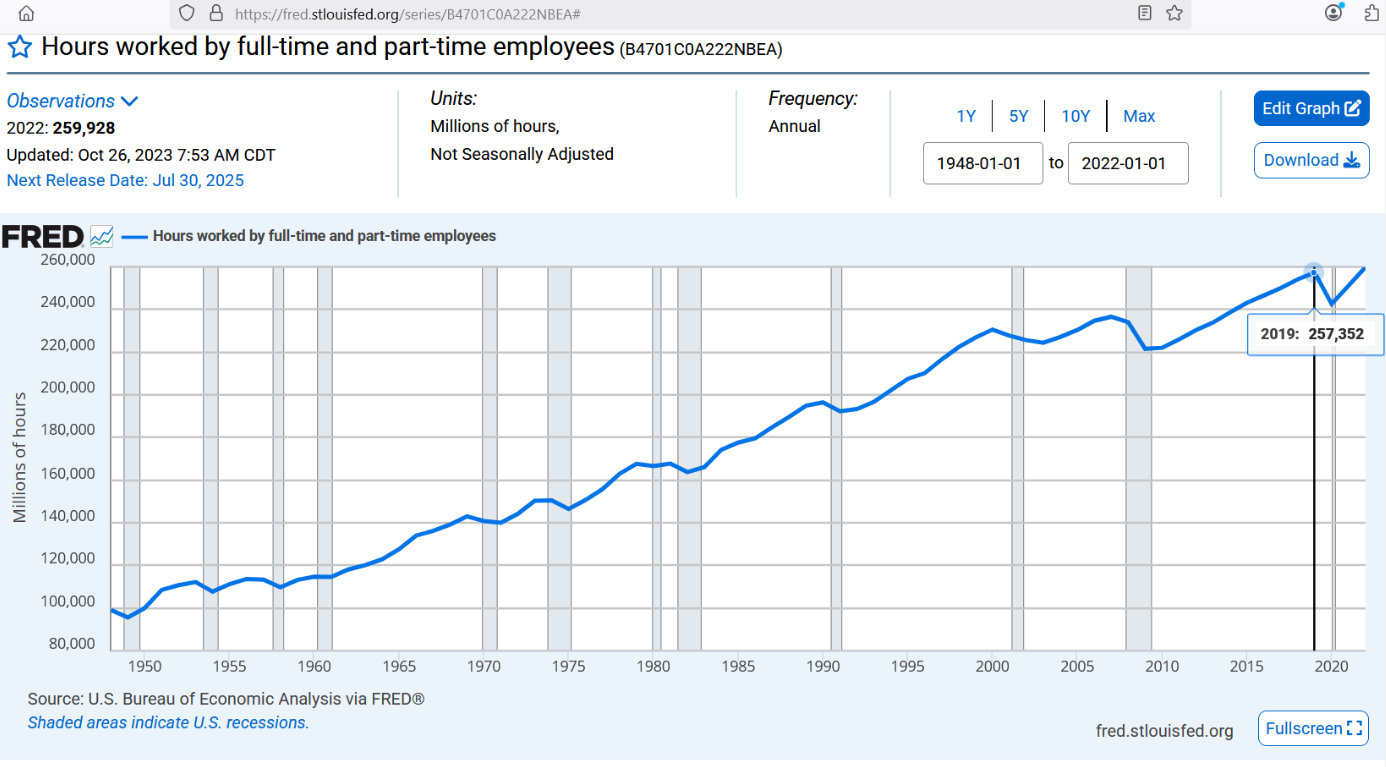
That’s 257.35 billion hours worked.
Hours worked in 2022

And by 2022 — 3 years later — the total hours worked had only risen by 1% to 259.93 billion hours worked. One percent job growth, over the span of 3 years, is terrible. It is less than 500,000 new jobs per year. With a smaller population and a smaller economy, Pres. Reagan averaged 1.8 million new jobs each year for the 8 years attributable to him.
Reference
U.S. Bureau of Economic Analysis, Hours worked by full-time and part-time employees [B4701C0A222NBEA], retrieved from FRED, Federal Reserve Bank of St. Louis; https://fred.stlouisfed.org/series/B4701C0A222NBEA
U.S. Bureau of Labor Statistics. Employment up 256,000 in December 2024; average gain of 186,000 jobs per month in 2024. https://www.bls.gov/opub/ted/2025/employment-up-256000-in-december-2024-average-gain-of-186000-jobs-per-month-in-2024.htm
U.S. Bureau of Labor Statistics, Business Sector: Hours Worked for All Workers [PRS84006032], retrieved from FRED, Federal Reserve Bank of St. Louis; https://fred.stlouisfed.org/series/PRS84006032
U.S. Bureau of Labor Statistics, Nonfarm Business Sector: Hours Worked for All Workers [HOANBS], retrieved from FRED, Federal Reserve Bank of St. Louis; https://fred.stlouisfed.org/series/HOANBS
U.S. Citizenship and Immigration Services Annual Statistical Report Fiscal Year 2023, Page 14. https://www.uscis.gov/sites/default/files/document/reports/fy2023_annual_statistical_report.pdf