Risk Visualization with Cates Plots
Post #1059
Public health officials sometimes take advantage of vagueness or ambiguity that is distorting the perception of risk among people. This lets them engage in “scare mongering” — making public announcements of doom-n-gloom if their special intervention measures are not followed. A case in point is COVID.
People were told that COVID is a scary disease and that nothing as bad as COVID has ever hit humans for full century — going back to the Spanish Flu of 1918.
True COVID risk = risk of severe COVID
But the Phase III trial for the Pfizer COVID shot showed the real risk of severe COVID. Cates Plots help you visualize risk, using green smiley faces for those who avoid an outcome altogether, and red faces for those getting a bad outcome. Here is the yearly risk of severe COVID using 1000 faces (1000 person-years of observation):
It doesn’t look that awful when you visualize. Each year, just 2 persons in a thousand end up with severe COVID. The actual number has even come down from that, now that COVID variants are no longer as severe as the wild-type. Here is the official record of the rate of severe COVID, which was used in order to create the visualization above:
The placebo group is on the right side of the table, and they were observed for 4,006 person-years. That’s equivalent to observing 4,006 persons for an entire year (or 40,060 persons for one-tenth of a year). At the end of the person-years of observation time, a grand total of 9 people came down with severe COVID. Everyone else was just fine.
When 9 cases in 4,006 person-years are observed, the incidence rate is (9/4.006= ) 2.2 cases per 1,000 person-years — which was utilized to create the visualization up top. Considering how 998 out of every 1,000 people were not at risk for severe COVID, it calls into question why you’d want to put an experimental injection into people.
Multi-dose vitamin D cuts risk of ICU in half
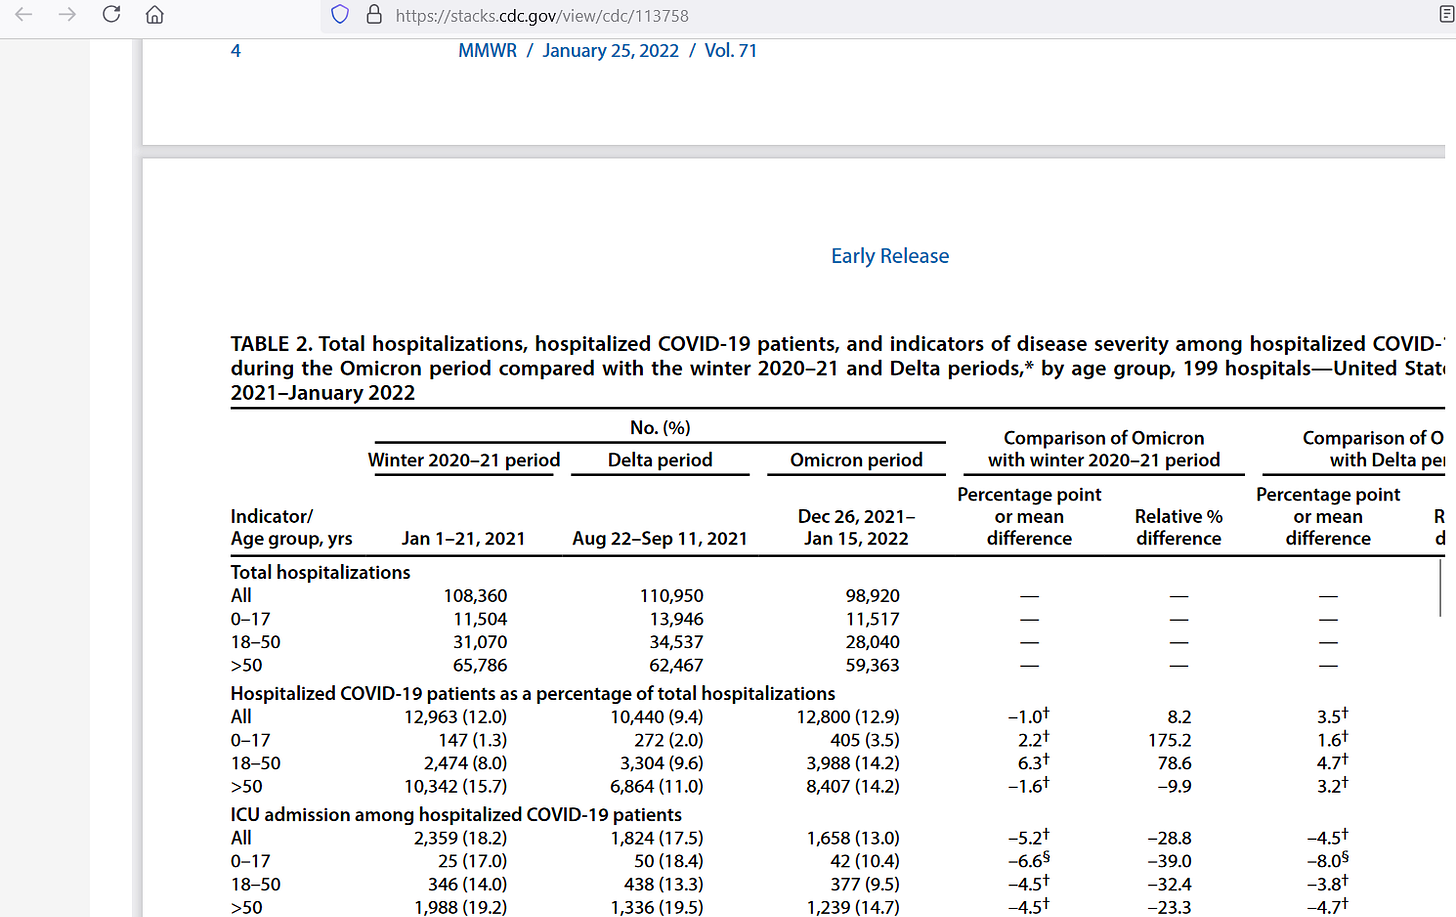
Another visualization would involve the risk of hospitalized COVID patients being admitted to ICU — because of symptom progression. The CDC found out that those over age 50 had the highest risk of getting admitted to ICU after first being hospitalized with COVID (bottom left showing a 19.2% ICU admission rate):
But when multi-dose (non-bolus dose) vitamin D is taken by people, the risk of ICU admission gets cut by 58%, so that it is only 42% of the baseline risk:
Bolus doses of vitamin D do not work well, a fact that has been known for years now, though researchers keep using them and keep getting poor results — blaming the poor results on vitamin D rather than on the “over-doses” that they gave people. Here is the risk visualization for those over age 50, where yellow turns green with vitamin D:
The top Cates Plot shows the situation when people do not proactively take vitamin D. The bottom shows those people (currently yellow) who would move from being red into the green zone, where they do not have to go to ICU, because of how well the vitamin D worked for them. These results from vitamin D are better than the standard of care.
The over-50 ICU admission rate is brought down to 8% with vitamin D. But compounds such as Remdesivir have not kept people out of ICU like that. Ivermectin has had approximately this large of a positive effect, but the standard-of-care pharmaceuticals — and COVID shots in particular — have not.
Reference
[webtool offered by Dr. Chris Cates for risk visualizations] — https://www.nntonline.net/visualrx/
[the yearly risk of severe COVID was 2.2 persons in a thousand] — https://www.fda.gov/media/144245/download
[19% of hospital patients over age 50 got transferred into ICU] — https://stacks.cdc.gov/view/cdc/113758
[bolus dosing of vitamin D is bogus] — Mazess RB, Bischoff-Ferrari HA, Dawson-Hughes B. Vitamin D: Bolus Is Bogus-A Narrative Review. JBMR Plus. 2021 Oct 30;5(12):e10567. doi: 10.1002/jbm4.10567. PMID: 34950828; PMCID: PMC8674779. https://pmc.ncbi.nlm.nih.gov/articles/PMC8674779/
[multi-dose vitamin D cuts ICU risk by 58%] — Meng J, Li X, Liu W, Xiao Y, Tang H, Wu Y, Xiong Y, Gao S. The role of vitamin D in the prevention and treatment of SARS-CoV-2 infection: A meta-analysis of randomized controlled trials. Clin Nutr. 2023 Nov;42(11):2198-2206. doi: 10.1016/j.clnu.2023.09.008. Epub 2023 Sep 20. PMID: 37802017. https://www.clinicalnutritionjournal.com/article/S0261-5614(23)00296-0/fulltext


I'm still not sure what "Covid" actually is, as I am a non-participant and personally don't have experience with it, but I like your use of visuals.