

Satellite data "against" Climate Change Theory
Satellite data "against" Climate Change Theory
A Warm Greenhouse Gas Layer is required by theory to exist (is not optional)

A warm greenhouse gas layer, at 3 miles up to about 6 miles above the surface of the earth (in the mid-troposphere), is a requirement for climate change theory.
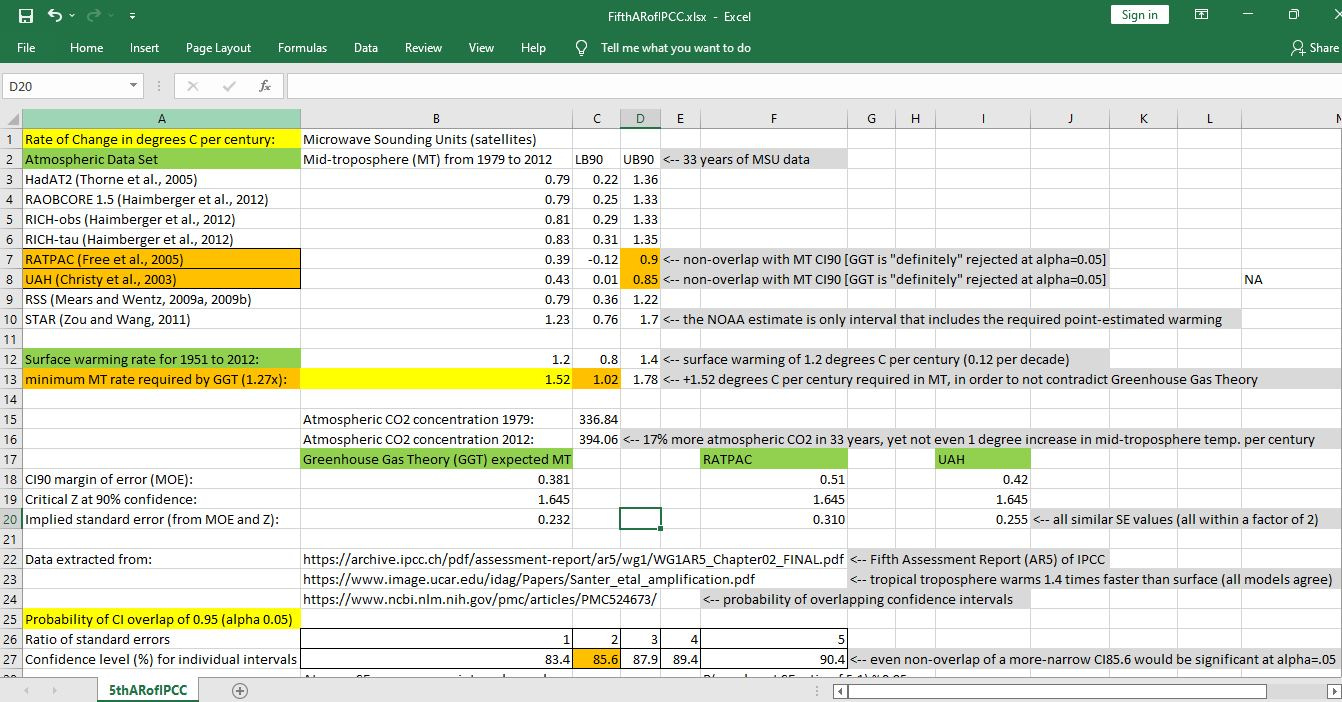
But at least two satellite data sets (RATPAC and UAH) taking “the temperature of” the greenhouse gas layer have confidence intervals around the trend of temperature change which do not even include the 90% lower bound on what is required for the Greenhouse Gas Effect (GGE) to be most responsible for recent surface warming.
Seven out of 8 data sets failed to have confidence bounds that include the point-estimated minimum mid-tropospheric warming required for a GGE to be the culprit behind recent warming.
The temperature of the greenhouse gas layer isn’t rising fast enough for the GGE to “work” (i.e., to be the cause of most of the recent warming).
Greenhouse Gas Effect: In order to get an extra degree of warming on the surface of the earth via a greenhouse gas effect, it is required that you increase the temperature in the greenhouse gas layer by AT LEAST 1.27 degrees.
Only the specific data set created by none other than NOAA (i.e., “government”) contained the point-estimated requirement for GGE to be behind the bulk of recent warming:
[click to enlarge]
With recent government lies around COVID, what does it mean when the ONLY data set that is consistent with GGE (warm gas layer directs heat back to the earth) is the government one?
The proper question at this time is ‘Cui bono?’ (Who benefits?), given how consistent we’ve been lied to.
Reference
[IPCC Fifth Assessment Report] — Table 2.8. “Trend estimates and 90% confidence intervals (Box 2.2) for radiosonde and MSU data set global average values over the radiosonde (1958–2012) and satellite periods (1979–2012). LT indicates Lower Troposphere, MT indicates Mid Troposphere and LS indicates Lower Stratosphere” at: https://archive.ipcc.ch/pdf/assessment-report/ar5/wg1/WG1AR5_Chapter02_FINAL.pdf
[The gas layer which is 3-6 miles up warms at least 27% faster than the surface of the earth does] — Figure 4c, tropical MT trend against surface temperature trend, but without correction for stratospheric cooling at: https://www.image.ucar.edu/idag/Papers/Santer_etal_amplification.pdf
[90% confidence intervals which fail to overlap are definitely significant at alpha=0.05] — Table 3. “Large-sample confidence levels of individual intervals that yield a probability of overlap of 0.95” at: https://www.ncbi.nlm.nih.gov/pmc/articles/PMC524673/