
Statistically-significant Doubling of Death in those under Age 40 who were Vaccinated
Early 2021 evidence in the UK

When examining whether a treatment causes more death, it is imperative to get the early measurements. This is because, after a treatment has caused more death, then those susceptible to harm will have been weeded out — and the treatment will no longer look as deadly (because those susceptible of dying would be gone).
You need the early numbers to see if many people have already died during treatment.
In an early (month of April) measurement of the death rates for those under 40 in the UK, those who had ever taken a vaccine were found to be more than twice as likely to die as were those who never took a vaccine.
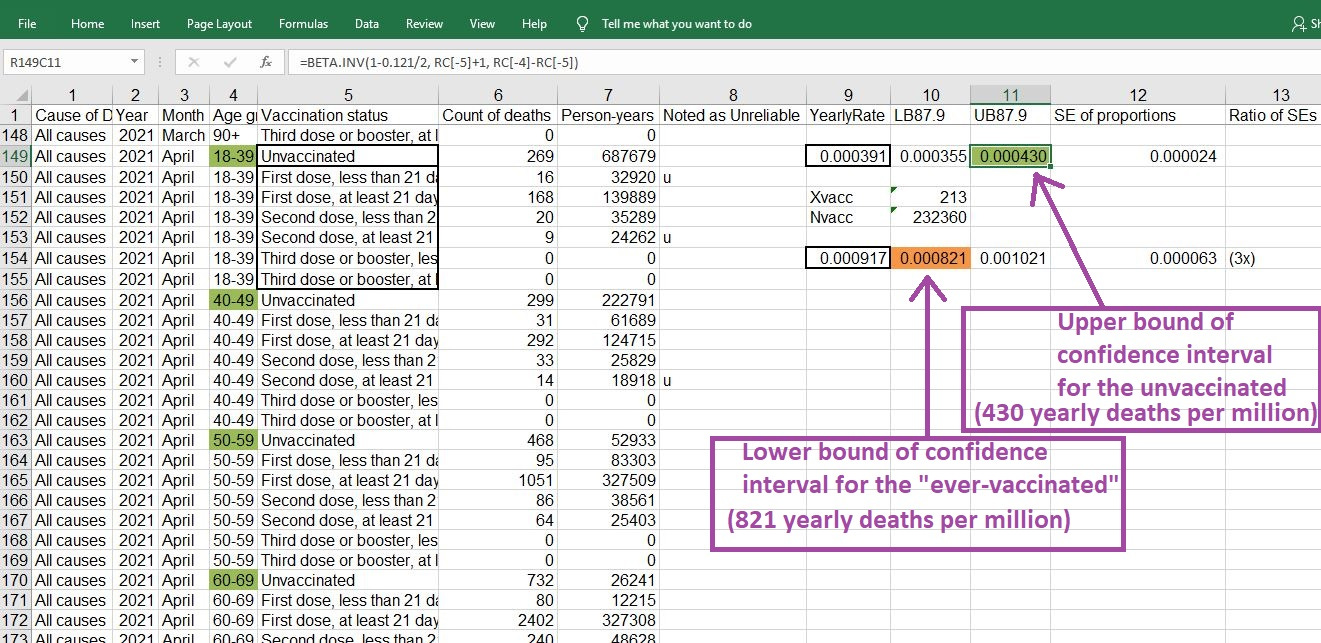
For April of 2021, the annualized death rate for those under age 40 who remained unvaccinated was 391 yearly deaths per million, while for those in that age group who had taken a vaccine, it was 917 yearly deaths per million (more than twice as much death).
A statistically-significant doubling of death is a very strong safety signal, and it at least strongly suggests that vaccines should never have been given to those under age 40.
While these data already “prove” net harm from vaccinating those under age 40, further data may reveal a net negative effect for those over 40 as well.
Critics may attempt to refute the findings by claiming that the age structure of those unvaccinated is much younger, even while in the range of 18 to 39 years old — but it wouldn’t be enough.
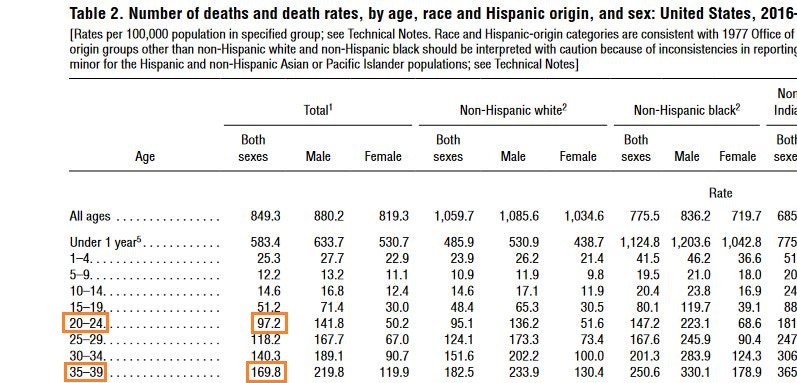
Even if the average age of the unvaccinated was 22 — while the average age of the vaccinated was 37 — it wouldn’t be enough to explain a more-than-doubling of death.
As data from the US in 2016 show, moving from the age bracket of 20-24 and up into the age bracket of 35-39 only increases the death rate by 74%:
Deep Stats
The statistical significance of the difference can be found in a few ways, and a conventional way uses a Z-test for the difference of proportions of deaths, or the deaths divided by the person-years of observation.
Such a test shows the difference above as being highly significant.
However, when annualized death rates are only ~500 in a million, the proportions are very small, and the validity of the Z-test can break down. The confirmation of significance here involves forming exact binomial confidence intervals of a very specific confidence level for each group, and then looking for overlap.
For technical details regarding why individual confidence intervals at 87.9% confidence were used in order to statistically verify that the vaccinated really did die faster, see the article by Payton et. al. cited below — specifically, Table 3 in that report.
Reference
CDC. National Vital Statistics Reports. Deaths: Final Data for 2016. https://www.cdc.gov/nchs/data/nvsr/nvsr67/nvsr67_05.pdf
[Table 3. Large-sample confidence levels of individual intervals that yield a probability of overlap of 0.95] — Payton ME, Greenstone MH, Schenker N. Overlapping confidence intervals or standard error intervals: what do they mean in terms of statistical significance? J Insect Sci. 2003;3:34. doi: 10.1093/jis/3.1.34. Epub 2003 Oct 30. PMID: 15841249; PMCID: PMC524673. https://www.ncbi.nlm.nih.gov/pmc/articles/PMC524673/
[Table 2. Monthly age-standardised mortality rates by vaccination status by age group for all cause deaths, deaths involving COVID-19 and deaths not involving COVID-19, per 100,000 person-years, England, deaths occurring between 1 January 2021 and 31 March 2022] — Age-standardised mortality rates for deaths by vaccination status, England: deaths occurring between 1 January 2021 and 31 March 2022: 16 May 2022. Age-standardised mortality rates for deaths involving COVID-19 by vaccination status, broken down by age group and sex. Deaths occurring between 1 January 2021 and 31 March 2022 in England. https://www.ons.gov.uk/peoplepopulationandcommunity/birthsdeathsandmarriages/deaths/datasets/deathsbyvaccinationstatusengland