
Sweden Fares Well vs. Select Sample of High Jabbers
Post #473

Swedish State Epidemiologist, Anders Tegnell, famously said in July of 2020:
Judge me in a year.
This post “judges” him — by way of comparison to a select sample of high-jab nations — after almost 3 years. Here is the comparative graph of the accumulation of excess death per 100,000:
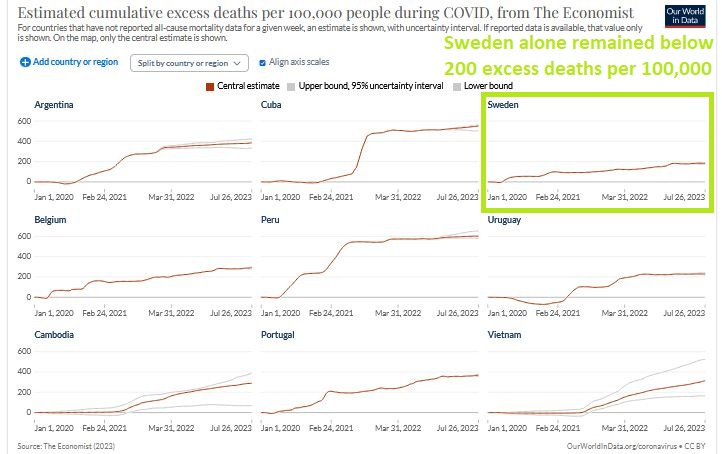
And here are the comparative jab uptake levels:
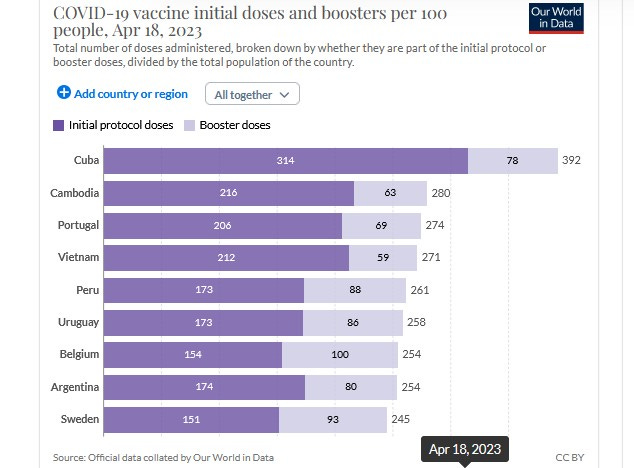
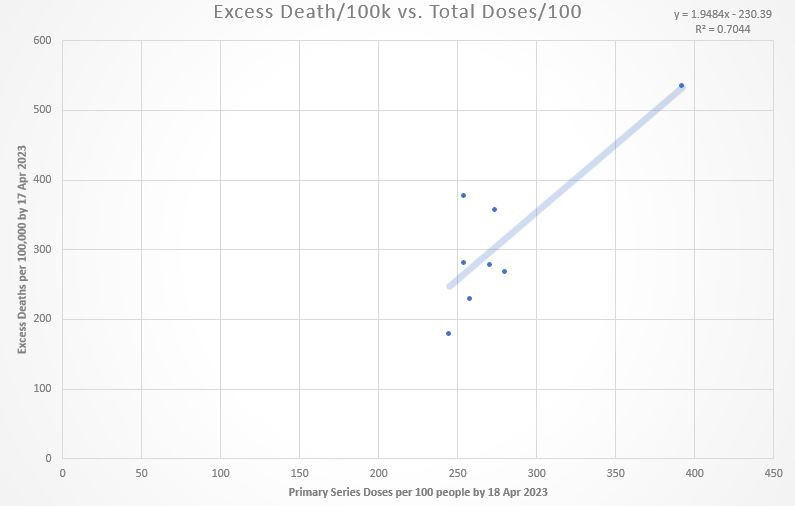
Because these jab uptake levels were recorded on 18 Apr 2023, a scatterplot was made with the excess death per 100,000 which had accumulated by 17 Apr 2023:
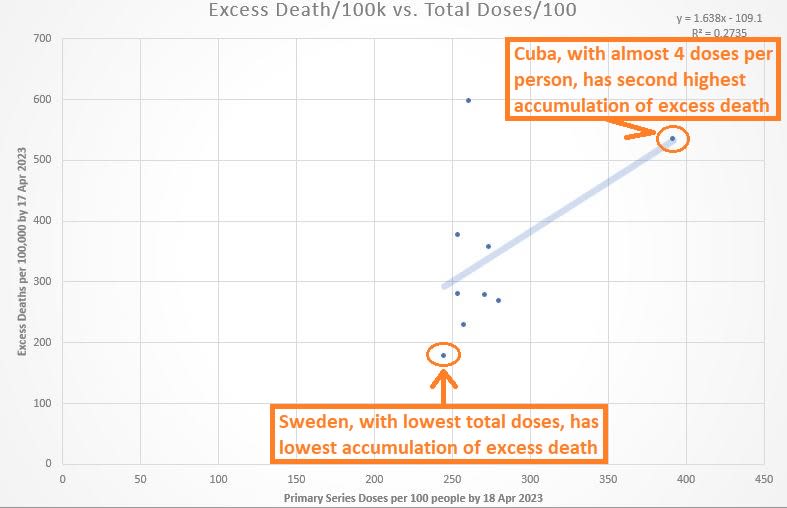
Note: That outlier at top is Peru.
That’s for the total number of administered doses per 100 people (horizontal axis), viewed against the accumulation of excess death per 100,000 people (vertical axis).
Another graph of interest is one that just looks at the uptake of primary series doses — those required in order to be considered to be “fully jabbed”:
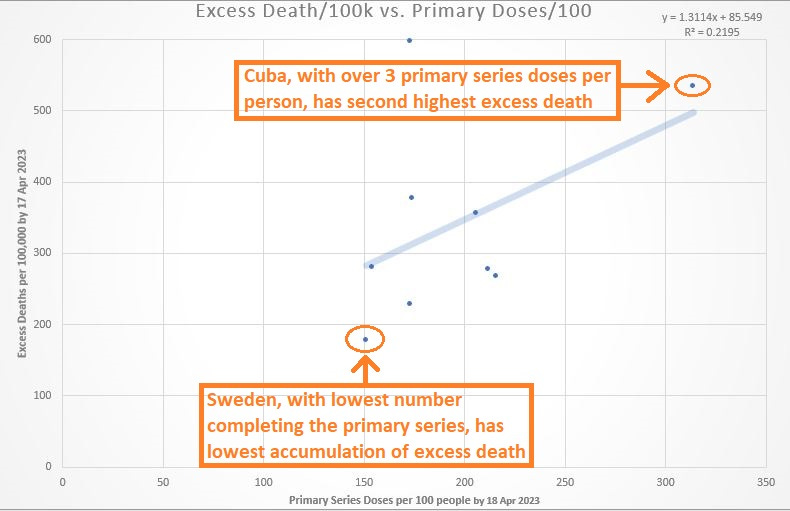
It is unclear how it could be that Cuba could reach more than 3 primary series doses per person if it only takes 2 primary series doses to become “fully jabbed.”
But the salient point is that COVID jabs not only do not appear to protect against excess death, but instead appear to be at least weakly associated with excess death (more jabs —> more excess death).
If the outlier (Peru) is removed, then the association of total COVID jabs vs. excess death becomes statistically significant even at the 1% significance level (alpha = 0.01):
Evidence suggests that Anders Tegnell made better public health decisions than the rest of the world, and that COVID jabs are associated with high accumulation of excess death.
Reference
[source for Anders Tegnell quote] — Unherd. Anders Tegnell: Sweden won the argument on Covid. https://unherd.com/thepost/anders-tegnell-sweden-won-the-argument-on-covid/
[jab uptake levels] — OWID. https://ourworldindata.org/covid-vaccinations
[cumulative excess death per 100,000] — OWID. The Economist. https://ourworldindata.org/excess-mortality-covid