

The Great Plunder: With economic freedom, bottom half had 60% more material wealth
The Great Plunder: With economic freedom, bottom half had 60% more material wealth
Comparing the difference of [nonfinancial assets - total liabilities] across time

Material wealth is different from ‘paper wealth’ in that it has real existence rather than potential existence. Paper wealth is nothing other than someone’s “promise-to-pay” (an I.O.U. which you hope will get paid to you some day, and which you hope will retain value).
To find material wealth, you begin with material assets — i.e., nonfinancial assets which are more real than “promises-to-pay” which are written down on pieces of paper (financial assets).
The claims on your assets are liabilities, and you can take them all away, leaving nothing but real, material assets which are wholly-owned because there are no debt-claims against them.
When done for the bottom half of the USA, you can see that it used to be the case that the bottom half owned over $7,000 in material assets (debt-free), on average. But by the third quarter of 2021, the bottom half of the USA owned less than $4,500 in material assets (debt-free), on average. The bottom half used to own 60% more.
Those values are both in constant 2021 dollars.
The CPI understates inflation
Getting material wealth into real values — tied to constant dollars of a given year — requires using an accurate index of inflation, such as the Social Security Wage Index.
The conventionally-used index for inflation, the Consumer Price Index (CPI), gives a less accurate picture. This is because government officials now insert subjective estimates of quality changes in products, a potentially-biased process called “Hedonic Quality Adjustment.”
With an accurate measure of inflation, you can compare material wealth from different eras across time. Because wages incorporate what people were requiring to buy the things that they wanted — a wage index of inflation sidesteps the supposed necessity of “quality adjustments” and makes the estimation of inflation more accurate.
Here are the notes, using an accurate measure of inflation, showing that the bottom half of the USA used to be 60% more rich than they were in 2021:
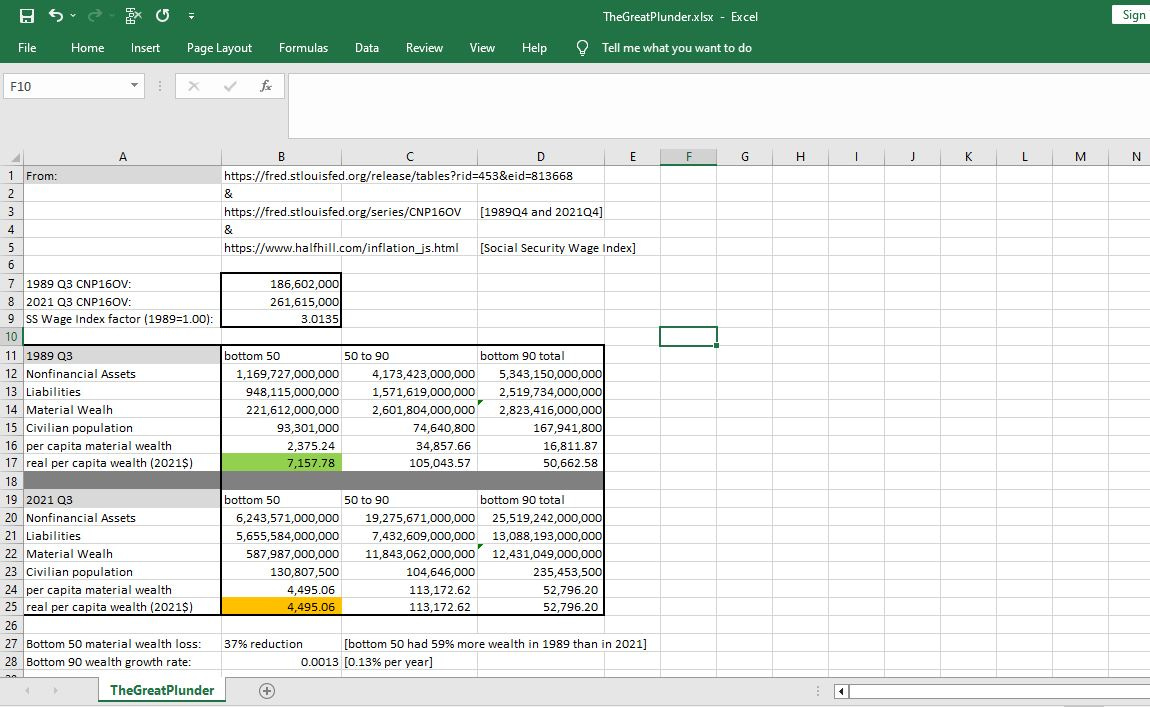
[click to enlarge]
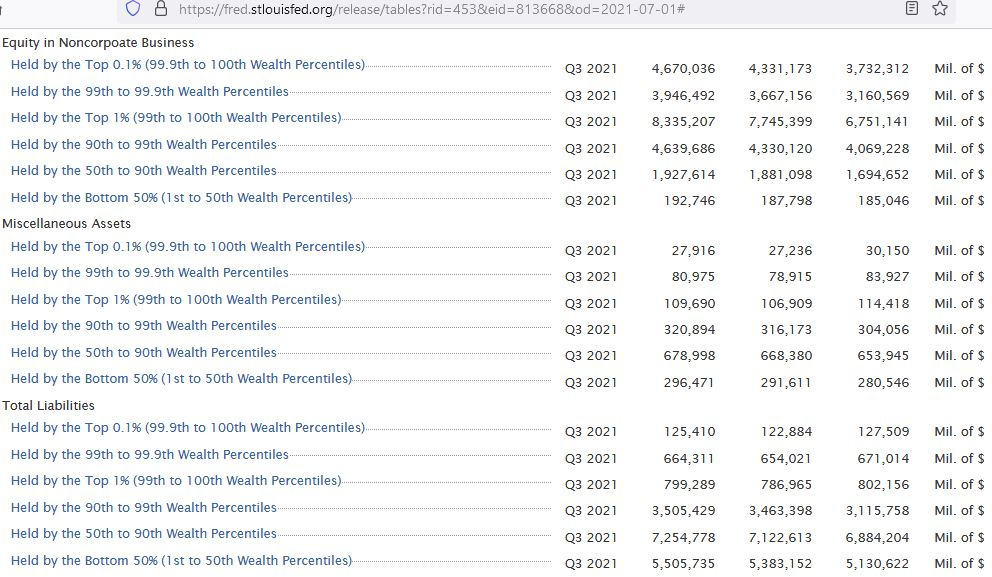
And here are the sources:
1989 Material (Nonfinancial) Assets for the bottom half of the USA:
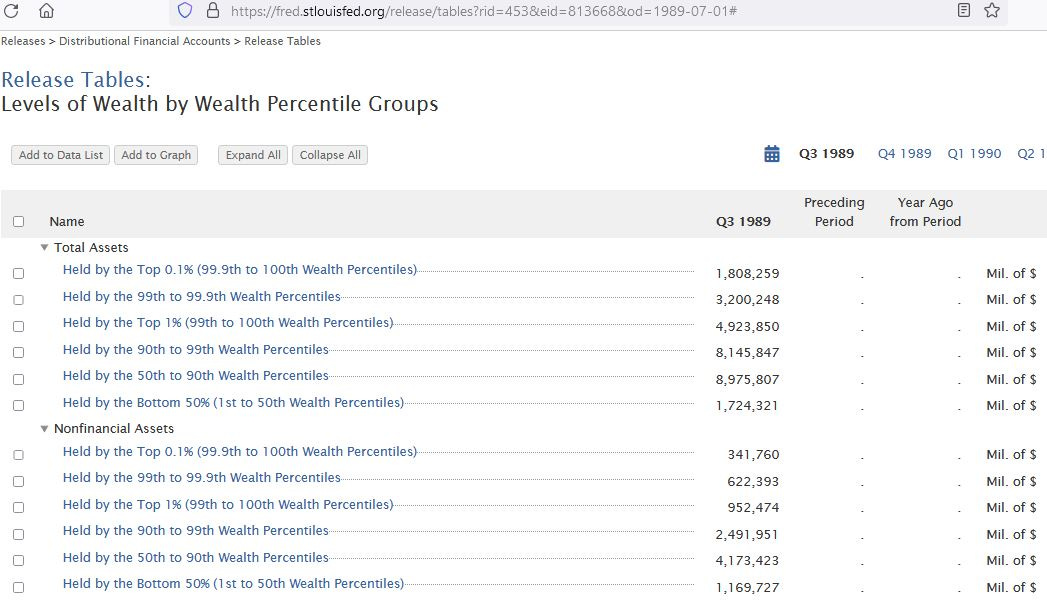
1989 Total Liabilities for the bottom half of the USA:

2021 Material (Nonfinancial) Assets for the bottom half of the USA:
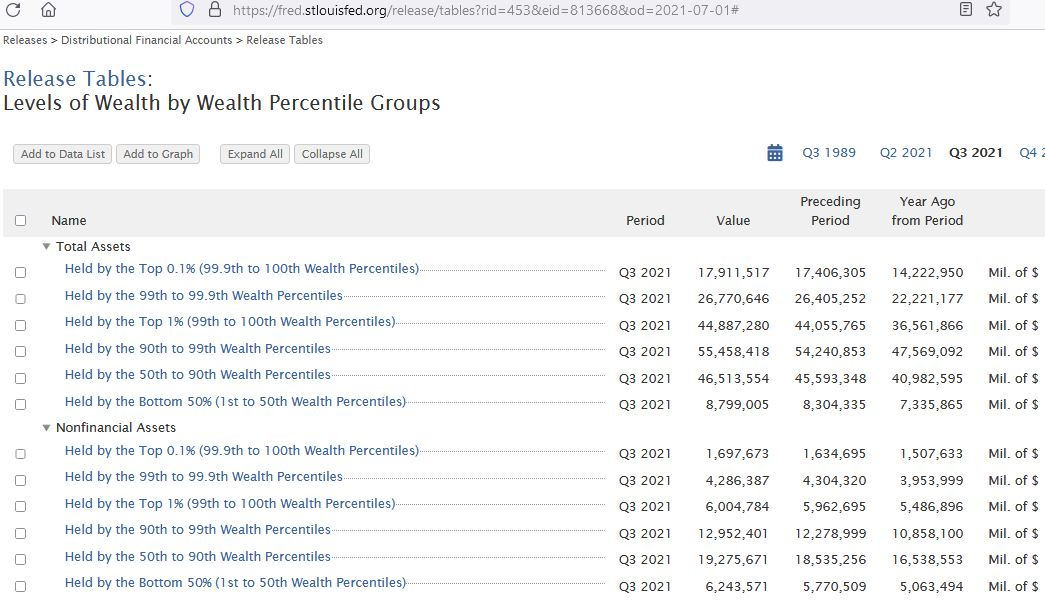
2021 Total Liabilities for the bottom half of the USA:
An accurate index to measure inflation:
Tom’s Inflation Calculator
Link: https://www.halfhill.com/inflation_js.html
Settings:
====
Dollar Amount (US): 100
Starting Year (for Dollar Amount): 1989
Target Year (for Converted Amount): 2021
Social Security Wage Index, 1951–2021
Show Raw Answers as Dollars and Cents
Calculate
====
The calculator shows that, due to inflation, $100 back in 1989 was worth $301.35 in 2021.
Conclusion
To get back to the situation we had in 1989, when the poor had more, we need to undo The Great Plunder (aka, The Great Reset) and restore the economic freedom we had. We do this by removing government regulations and by eliminating lavish government spending and also the “public-private partnerships” which are, essentially, nothing but corporate fascism.
When the government teams up with corporations against the people, like we saw with Twitter, that’s fascism. When need less of that, not more of it. Just say “no” to the Great Fascist Reset.