

The Receipts for "Jabs linked to Deaths"
The Receipts for "Jabs linked to Deaths"
Post #495

This substack post more or less serves to provide “the receipts” for this prior substack where it was shown that taking COVID jabs leads to excess deaths. Here are the spreadsheet notes which created the graph showing that rising jab uptake levels lead to rising excess death levels:
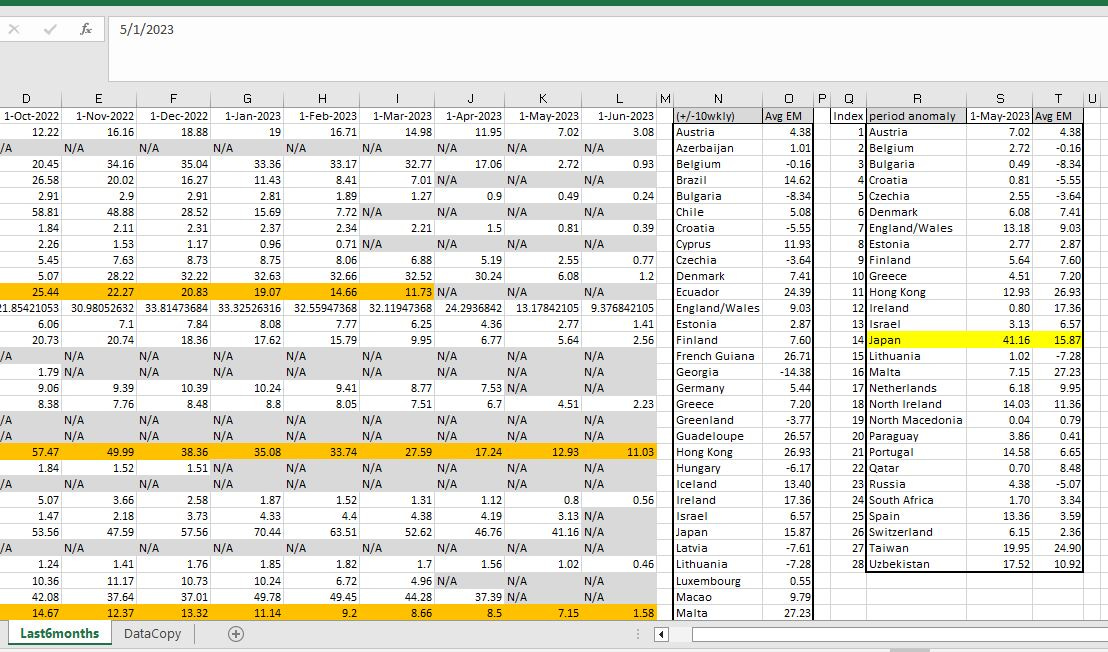
At right, after meeting inclusion criteria, both excess death and jab data were available (from ourworldindata.org) for 28 regions up to 1 May 2023. Japan is highlighted as a potential outlier and removing it led to even worse predicted effects from COVID jabs.
More data had been available for regions up to 1 Apr 2023, and even those data were predictive of excess death from 31 May 2023 going forward:
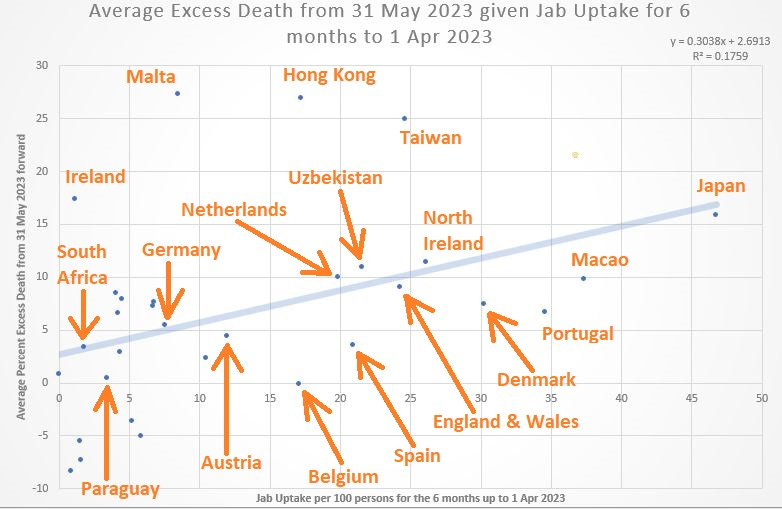
Though excess deaths weren’t recorded until 31 May 2023 going forward, and this graph only goes to 1 Apr 2023 for jab uptake, this early jab uptake was still statistically predictive of excess death.
A comparison of extremes, using Japan and South Africa, follows. Here are their 6-month, moving average jab uptake levels:

For the 6 months ending on 1 Feb 2023, 63.5% of Japan’s population had been jabbed, but less than 2% of South Africa took a jab in those 6 months. Let’s see how things turned out in each nation:
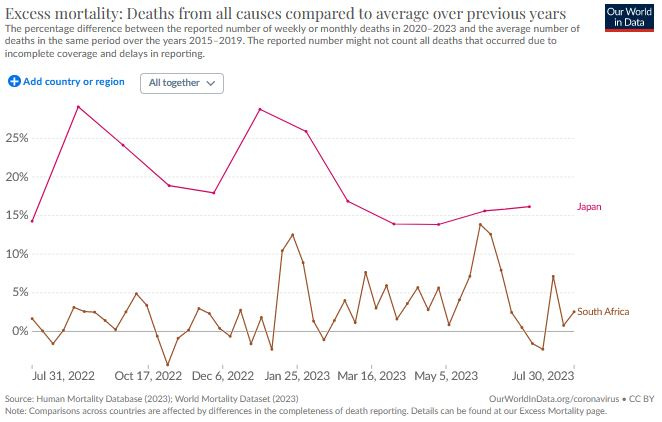
Japan’s excess death rate is horrifying when compared to that of South Africa’s. Here is the same graph with notes marking off those 6 months when Japan gave 33 times as many COVID jabs as South Africa:
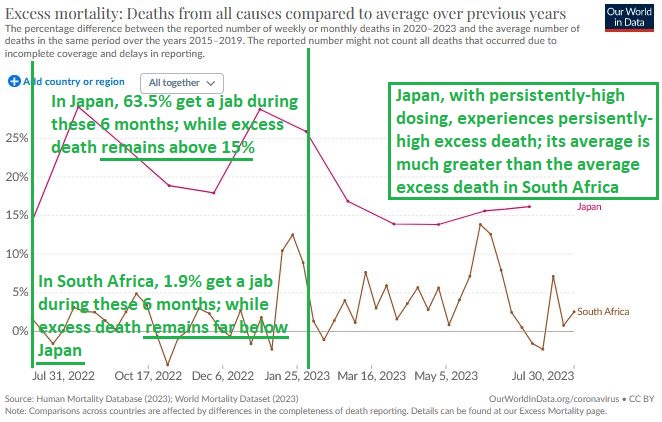
Giving out 33 times as many COVID shots as South Africa was counterproductive, and it led to an average excess death which was much higher. One wonders what Japanese officials would do if they ever get presented with these data, given the high premium which has historically been put on preserving one’s honor in Japan.
Evidence suggests that having a high proportion of your population “up-to-date” with COVID jabs leads to having high average excess death going forward.