

In this recent Substack by
, a Medicare death data dump is available. There are about 114,000 recorded deaths below age 80 in there, all from 2020 up to the near-present.The mean age at death was 72.23 years, and the mean days-to-death (after getting jabbed) was 318 days. This implies that the mean age upon getting jabbed was 71. But the problem with 71 year-olds dying within 318 days is that it is not expected.
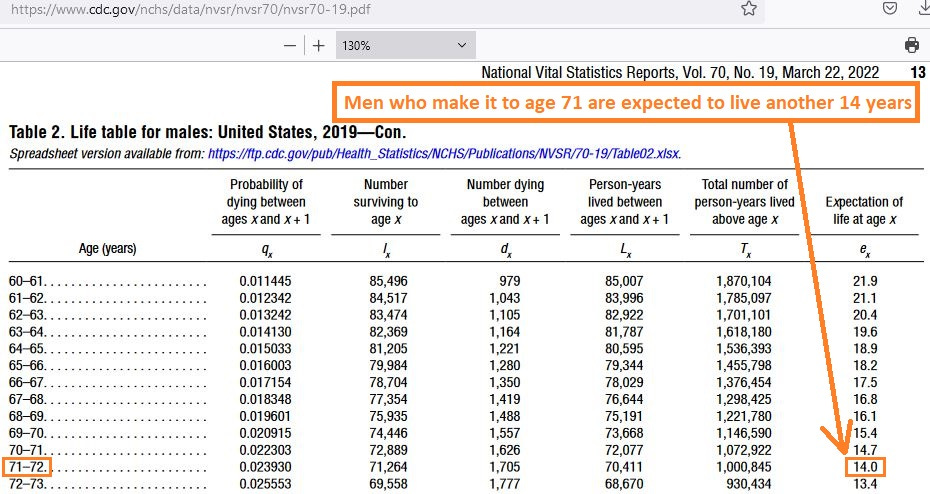
Here is the expected life remaining for a male who made it to age 71:
But not everyone makes it to the expected number, so there is variation around the mean number of life-years remaining. A good guess at the standard deviation of life-years remaining comes from OECD data on remaining life expectancy at age 65.
The standard deviation was anywhere from 1.5 to 3.0 years depending on the year and the gender that you analyze. But even the worst-case scenario of a standard deviation of 3 years reveals that those living only 318 days post-jab were, in fact, dying at 4 standard deviations above expecations.
That’s fine if they only represented 0.00003 of all deaths recorded, because 0.00003 of all deaths recorded are “supposed to” be within 318 days (4 standard deviations above expected rate).
But following the logic to where it leads, then that would imply 3.6 billion Medicare deaths since 2020 (which is absurd). The reasonable conclusion is that jabs are increasing the death rate among the Medicare population, at least.
Technical Note: The standard deviation of a mean life expectancy is more narrow than the standard deviation of life expectancy on an individual basis. The standard deviation of a mean life expectancy would be the standard error of the mean. The individual-basis standard deviation for those of age 65-70 is about 7-8 years, but OECD data reveal “time-space-gender” movement in the mean life expectancy and a standard error of about 1.5 to 3.0 years. Final Caveat: All data is on deaths though, and the survivors are missing from this data set.
Reference
[OECD life expectancy at age 65] — OECD. Life expectancy at 65. https://data.oecd.org/healthstat/life-expectancy-at-65.htm
[2019 US Life Tables showing that men aged 71 can expect another 14 years of life; Table 2; Page 13] — CDC. NVSR70. Volume 70, Number 19. United States Life Tables, 2019. by Elizabeth Arias, Ph.D., and Jiaquan Xu, M.D., Division of Vital Statistics. https://www.cdc.gov/nchs/data/nvsr/nvsr70/nvsr70-19.pdf
The database is only of people who died, and who got the shot. Lots of 70 year olds lived longer than this, but it’s not shown in the data.