

The Worst 52 Weeks of "COVID"

In this prior post, the excess death rate during severe flu in Europe got compared to about 70 regions during COVID. Here, the severe flu rate gets compared to 2020 excess death rates for 237 regions, but also to the worst 52 weeks of excess death.
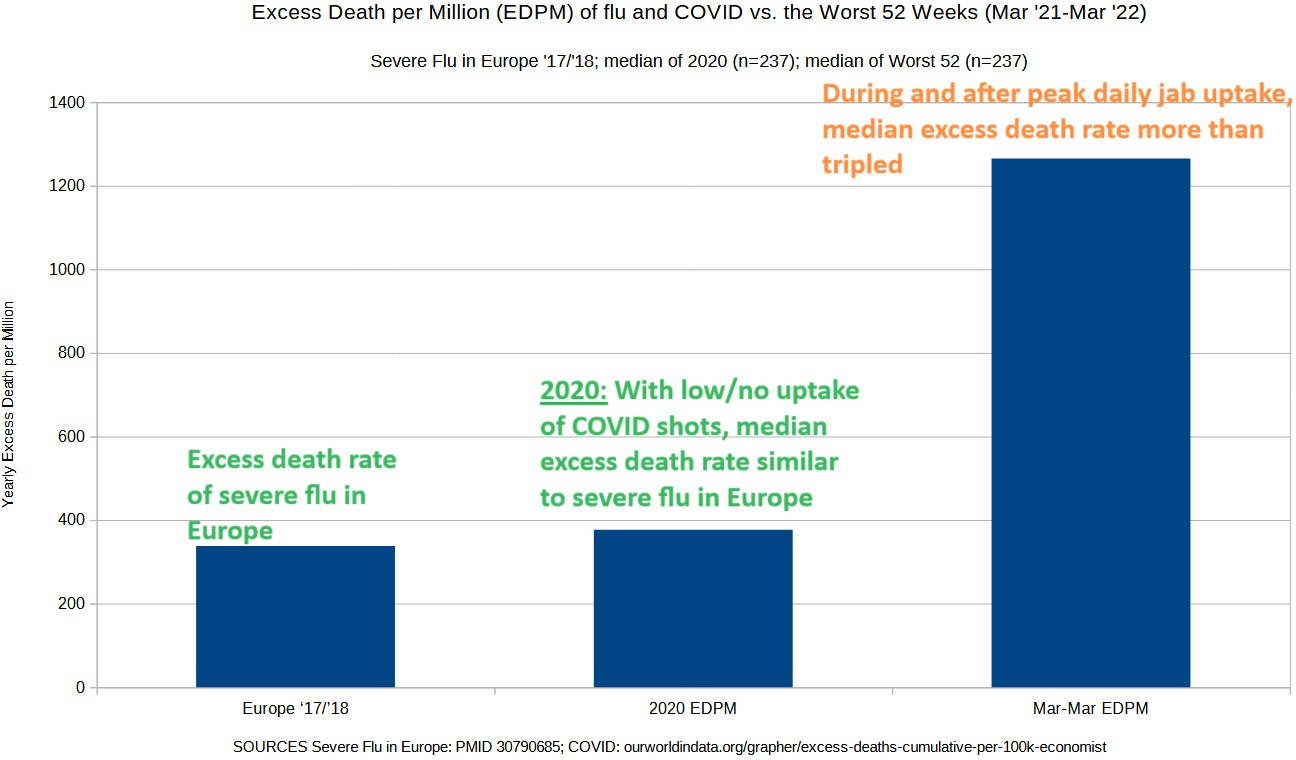
The time frame for the median excess death rate at right spans from 8 Mar 2021 to 7 Mar 2022. But now let’s look at the world average daily jab uptake levels and mark off that time frame when COVID became 3x worse than it was in 2020:

The worst 52 weekly excess death rates were also the highest 52 weeks of administration of COVID shots — indicating that the COVID shots were able to triple the death during COVID (using 2020 as the baseline for expectation).
Reference
[7-day average daily jab uptake of the world] — OWID. https://ourworldindata.org/covid-vaccinations
[accumulation of excess deaths per 100,000] — The Economist. OWID. https://ourworldindata.org/grapher/excess-deaths-cumulative-per-100k-economist
[excess death from the 2017/18 flu in Europe was 33.8 per 100,000] — Nielsen J, Vestergaard LS, Richter L, Schmid D, Bustos N, Asikainen T, Trebbien R, Denissov G, Innos K, Virtanen MJ, Fouillet A, Lytras T, Gkolfinopoulou K, Heiden MA, Grabenhenrich L, Uphoff H, Paldy A, Bobvos J, Domegan L, O'Donnell J, Scortichini M, de Martino A, Mossong J, England K, Melillo J, van Asten L, de Lange MM, Tønnessen R, White RA, da Silva SP, Rodrigues AP, Larrauri A, Mazagatos C, Farah A, Carnahan AD, Junker C, Sinnathamby M, Pebody RG, Andrews N, Reynolds A, McMenamin J, Brown CS, Adlhoch C, Penttinen P, Mølbak K, Krause TG. European all-cause excess and influenza-attributable mortality in the 2017/18 season: should the burden of influenza B be reconsidered? Clin Microbiol Infect. 2019 Oct;25(10):1266-1276. doi: 10.1016/j.cmi.2019.02.011. Epub 2019 Feb 18. PMID: 30790685. https://pubmed.ncbi.nlm.nih.gov/30790685/
Excellent. What could be more clear and convincing?