


Top Nation for mRNA Uptake
Post #1316

The top nation doling out the most experimental COVID shots to its people is Cuba:

At over 400 doses per 100 persons, this means that, on average, each person has taken at least 4 doses. But Cuba does not use any mRNA shots, such as Moderna and Pfizer:

This makes Japan, with 347 doses per 100 persons, the top nation in the world for uptake of mRNA shots (no nation has given more mRNA doses to its own people than Japan has). People may say that Chile ended up giving more total doses, but Chile gives mostly non-mRNA shots:

And in Japan, over 99% of all COVID shots given out are mRNA (either Pfizer or Moderna):

Now that we know that the people on Earth who were most exposed to mRNA shots are those in Japan, we can ask how they compared to the rest of the world in terms of excess mortality. If mRNA shots help, then people in Japan would be expected to have lower excess mortality than the world average — because no others got as much mRNA.
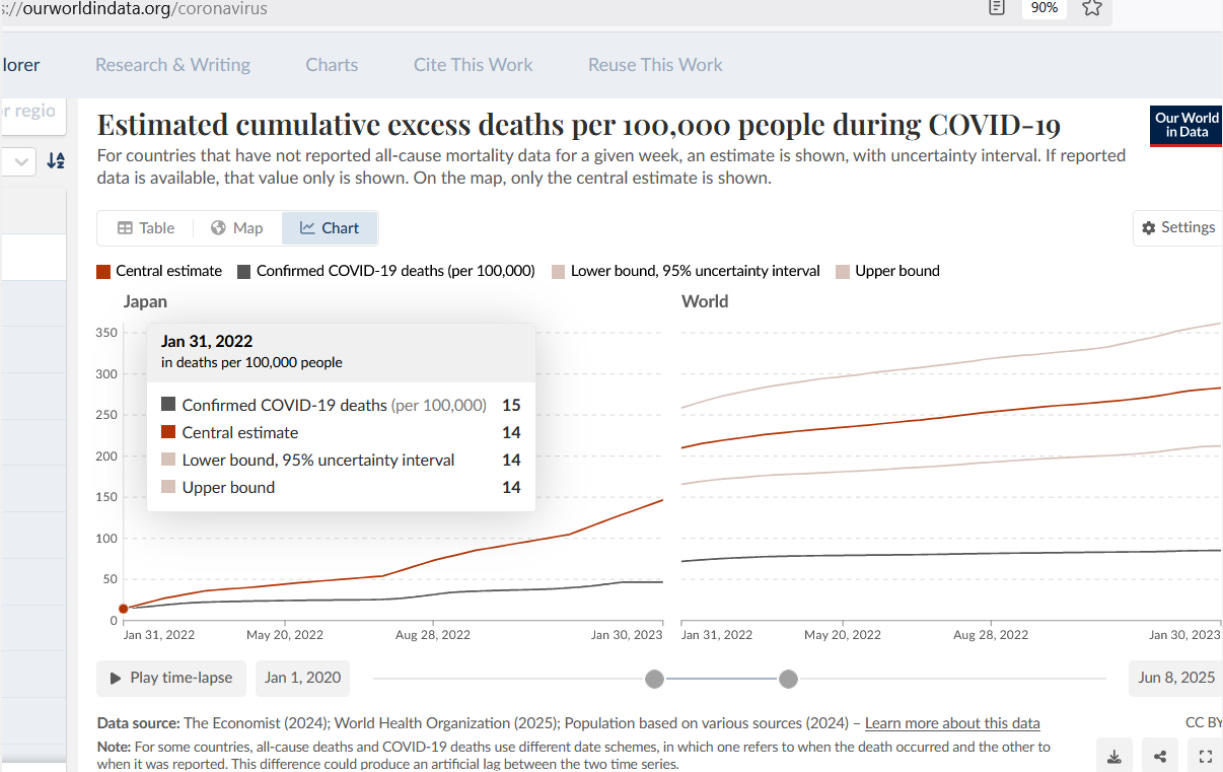
A side-by-side comparision of the accumulation of excess death makes it look like Japan did better than the world average:

While, on 30 Jan 2023, Japan was sitting at an accumulation of 150 excess deaths per 100,000 people, the world on average was approaching 300 excess deaths per 100,000 persons. But you might notice something about the slope of the lines, which shows us the “accrual rate” of new excess deaths through time, and Japan’s rate is much faster.
Here is an overlay of daily dosing schedules to help us set a time point for when we can begin to blame excess deaths on COVID shots, rather than on COVID disease:

At far left you can see that the world, on average, began giving out COVID shots earlier than Japan did (blue line higher than red). And then you have a period where both Japan and the world were experiencing a peak in COVID shot uptake (prior to 12 Sep 2021). The day of 31 Jan 2022 is marked off as special, though.
From this day forward, not only did the world average of COVID shot uptake drop consistently, but for Japan, they continued to administer a lot of mRNA COVID shots to their people, providing a stark contrast in exposure to mRNA — with Japan outpacing the world, by far, in population exposure to mRNA. But did it work out?
Let’s return to the side-by-side accumulation of excess death graph, but with a baseline set to 31 Jan 2022, and going out for 52 weeks to 30 Jan 2023:
World

On that baseline day of 31 Jan 2022, the world average accumulation of excess death was 210 excess deaths per 100,000 persons. But over the course of a year (52 weeks), how much more excess death did the world, on average, accumulate?

By 30 Jan 2023, the accumulation of excess death had risen from 210 up to 283 excess deaths per 100,000 — which indicates an accrual rate of excess death of (283 - 210 =) 73 new excess deaths per 100,000 person-years. Now let’s compare the world average accrual of excess deaths to Japan’s yearly accrual of excess death:
Japan
Japan had a baseline accumulation of excess death of 14 excess deaths per 100,000 persons by 31 Jan 2022 — which is much smaller than the accumulation of excess death which would have been seen for seasonal flu in Japan (see end-note below for details). Now let’s see how much death accrued in this nation that was taking the most mRNA:

Japan ended the year with 147 excess deaths per 100,000 persons. Subtracting away the baseline accumulation of excess death which had occurred up until 31 Jan 2022, we find a yearly accumulation of (147 - 14 =) 133 new excess deaths per 100,000 persons — far beyond the world rate, and far beyond any excess death ever seen with seasonal flu.
When the top nation in the world for mRNA exposure (Japan) is compared to the world average, it is no contest: excess death was 82% higher in Japan as compared to the world average. While COVID wasn’t very harmful in Japan — as indicated by the low accumulation of excess death through to 2022 — mRNA shots were very harmful.
A confirmation of this tragedy shows up in a report citing the government payouts for injury and death following mRNA shots in Japan, showing how the payouts have already surpassed the payouts for all other vaccinations over the last 47 years, combined:

An Example Year of Seasonal Excess Death in Japan
To find a benchmark for how much excess death would be expected in Japan associated with a seasonal flu, notice how the flu season below had coincided with 40,000 excess deaths:

Because Japan’s population was 126.5 million back then, the excess deaths were 31.6 per 100,000.
Perhaps a benchmark of excess mortality with Tanzania and Bulgaria, with << treatment would come in handy. Or, a multi country data analysis of the treatment rollout percentage, vs excess mortality may yield a correlation?
What are we to make of these much lower than flu deaths prior to injections to much higher than flu post injections? Cause of death data would reveal plenty.