

Up-to-Date Risk:Benefit Analysis
Up-to-Date Risk:Benefit Analysis
Current Estimate of Vaccine Benefit and Harm

No Hard (constant) Numbers for RNA Viruses
The mutation rate of RNA viruses like SARS-CoV-2 indicates that literally dozens of new variants get created each year. That’s more than one per month.
This means that it is practically impossible to settle on a characterized level of risk or lethality for COVID-19 , and one method is to just keep cumulative statistics and report them.
But using cumulative data to characterize a virus that evolves towards less lethality over time is heavily biased, because when it was completely-novel, an excess of death will be expected to build up in a very short time — and it’d take a long time for the cumulative lethality to drop down to the real, time-specific rate of lethality.
Analogy to Gambling
Think of collecting statistics on gambling outcomes, but by beginning the collection of your statistics right at the point where you had just won a million-dollar jackpot. A week later, when you haven’t won anything else, your average wins are still $500,000 per week of gambling.
Two weeks after that, after not winning even a single thing for 4 total weeks after your jackpot, your average wins are still $250,000 per week of gambling. But that’s absurd.
Nobody can win an average of $250,000 for every week that they gamble — the casinos would all go bankrupt.
As it turns out, it’d take a very long time of winning “nothing” before your average weekly gambling wins approached the true rate, such as something like “$0 per week of gambling” or “-$500 per week of gambling”, or whatever.
Instead of using cumulative data to measure harm from a disease which mutates a lot, like all RNA viruses do, it is more correct to use only updated data.
Application to Vaccines
When applied to COVID vaccines, it can be expected that early analyses predicted that there would be a lot more benefit than harm. And it is also proper to expect that, over time, vaccines would become less and less beneficial, and more and more harmful.
A worry-point from extensive COVID vaccine use can be found by comparing excess mortality before vaccine rollouts against excess mortality after vaccines rolled out. In the working-age population in the USA, excess mortality never reached 60% — until late in 2021, after vaccines had rolled out.

Also, in at least 6 of the most-vaccinated nations — all at vaccine uptake levels of 212 doses/100 people or more — the vaccine rollouts, and also the steadily-increasing vaccine coverage, were associated with increases in excess mortality.
In 3 of the 6 nations — i.e., Denmark, Gibraltar, and South Korea — very little in the way of excess mortality was seen before the vaccine rollouts, and a disturbingly-steady increase in excess mortality was seen after the vaccine rollouts.
These time frames are outlined by purple boxes in the graphic below.
South Korea was somewhat “late to the party” because, even by 9 July 2021, they still had not administered any more than 40 doses of vaccine for every 100 people. Forty doses per 100 people seems to be a critical area for excess mortality, as excess mortality tends to be rising as nations approach that critical threshold.
This is logical because there is a “sweet-spot” regarding rate of increase in death:
If too few get vaccines, then too few will die, and excess mortality doesn’t rise — but if too many have already gotten vaccines, then too many will have already died, and the ensuing excess mortality won’t be able to rise by much (related to where it just had been before, when the bulk of people had first taken a vaccine).
But right around that critical point where around 40 doses have been administered per 100 people, the excess mortality in South Korea was — just like in Denmark and Gibraltar, and also in Chile and Ireland and Qatar — on a steady, upward climb.
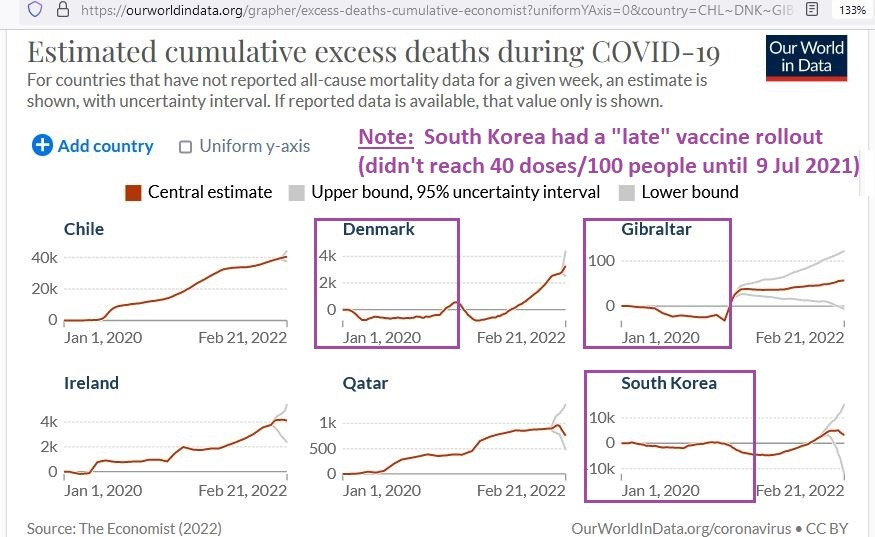
The take-away message is that, even though COVID was becoming less and less lethal for the entire year of 2021 (and into 2022), really high vaccine uptakes in several nations were associated with steady climbs in excess mortality.
This kind of finding would prompt a timely re-analysis of risk, harm, and benefit from vaccines — using updated estimators.
Up-to-Date Risk:Benefit
To find the benefit of a vaccine, in lives saved, requires first knowing 4 numbers:
1) the underlying attack rate (rate of new infections) of the disease
2) the vaccine effectiveness (VE), otherwise known as relative risk reduction (RRR)
3) the number-needed-to-vaccinate (NNV) derived from absolute risk reduction (ARR)
4) the infection fatality rate (IFR); to translate prevented infections to prevented deaths
To find the harm, in lives lost, of a vaccine —while using a passive surveillance mechanism, such as the VAERS database — requires knowing the evolution of the rate of reported deaths, along with an estimate of the “system capture” of underlying deaths.
Benefits
The Pfizer trial tested people for evidence of prior infection and found that, when fully-susceptible to COVID (no evidence of prior infection), the attack rate over the course of 6 months is 4.7%.
For those with antibody evidence of prior infection, the 6-month attack rate was 1.3%.
An up-to-date estimate of vaccine effectiveness for variants of COVID which arose after the Alpha variant (e.g., Delta and beyond) would be, in the best case, 84% VE and, in one of the worst cases reported in literature, 39% VE.
The top vaccine effectiveness against Delta variant in a systematic review of real world evidence was 84%, but it was noted that vaccine effectiveness in Israel had already dropped down to 39%.
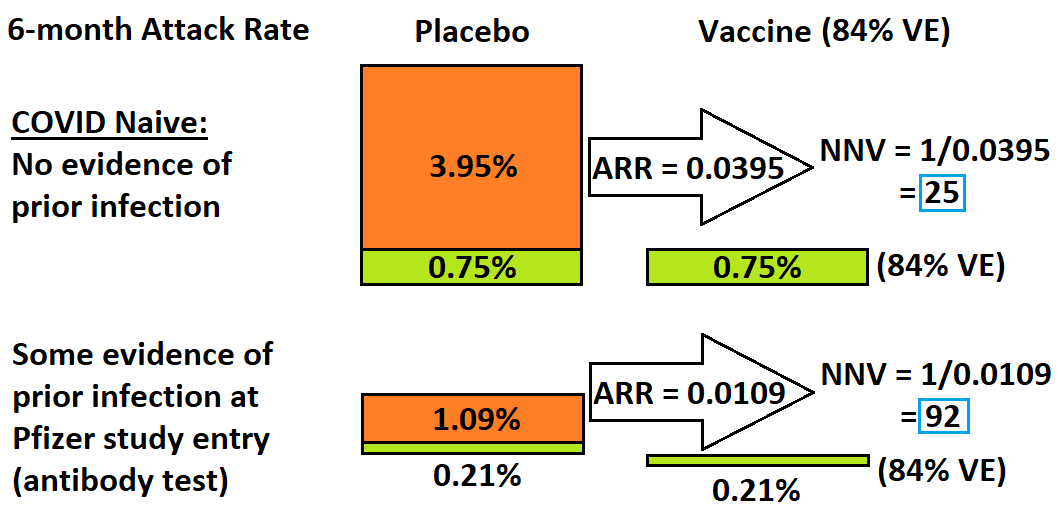
In a population completely naive to COVID (a 100% novel virus), vaccination would be expected to bring the 6-month infection rate down from 4.7% to just 0.75% (an 84% relative reduction).
But the absolute risk reduction (ARR) would then be (4.7-0.75=) 3.95%, or 0.0395. The number needed to vaccinate (NNV) — i.e., to prevent one single infection — would then be 1/ARR = 1/0.0395 = 25.
When attempting to vaccinate people who had prior exposure to COVID, that number rises to 92, as shown in the blue boxes in the following graphic:
An up-to-date estimate of COVID lethality is an IFR of 0.1%, as taken from UK Technical Briefing #5, where it was officially recorded by the UK government that approximately 65,000 COVID-positives were followed for at least 28 days and 65 of them died.
If 25 people need to be vaccinated to prevent one infection, and the up-to-date IFR is 0.1%, then it reveals that 25,000 need to be vaccinated to prevent one death (at 1 death per 1000 infections; IFR = 0.1%).
That’s the best-case scenario, when people were the most susceptible, and when vaccines had the most effectiveness that you’d expect for them to ever have. At that same upper estimate on vaccine effectiveness, but this time for those exposed to COVID-19, you’d need 92,000 vaccinations to prevent one single death.
Keep in mind that initial “full vaccination” requires two doses, because the harms data below will be measured on a per-dose basis. If 92,000 full-vaccinations are needed to prevent one death then, initially at least, that requires 184,000 vaccine doses.
The lower estimate of vaccine effectiveness, taken from the vaccine experience in Israel, would lead to the following graphic:

Notice how the numbers you need to vaccinate (to prevent one single infection) are much higher in each group when effectiveness is lower. In a population completely naive to COVID (no evidence of prior infection), you’d need to vaccinate 55,000 people to prevent one death.
In a population already exposed to COVID, at an up-to-date IFR of 0.1%, you’d need to vaccinate 196,000 people just to prevent one death. Put in terms of single doses required to prevent one death, that’d be 392,000 doses, just to prevent one death.
Harms
The reporting rate of deaths to the VAERS database is 8.2 reports of death for every million vaccine doses administered, or 1 death reported for every 122,000 vaccine doses.
Because of low capture rates of underlying events, VAERS numbers need to be multiplied by an under-reporting factor (URF).
For Guillain-Barré syndrome, a rare neurological disease almost impossible to miss (due to how rare and grave it is), the capture rate goes down to 12%, ranging from 12% to 64% in one study.
It is more likely for Guillain-Barré syndrome to be captured by the system than for deaths to be captured by the system — even though death is more grave. That’s because people die much more often (900 per 100,000 yearly) than they get Guillain-Barré syndrome (1 per 100,000 yearly).
Death as a random or general outcome is about 900 times more likely than Guillain-Barré syndrome is. This makes the 12% capture rate sort of an upper limit of expected capture rates for deaths reported in VAERS.
If Guillain-Barré syndrome occurs, it is expected that it will get reported and that the VAERS system will capture it — i.e., because it so very rarely happens “on its own”, people who got it would be expected to more-automatically associate it with things like vaccine exposure.
At this plausible upper limit of 12% capture of underlying deaths, then the factor which you’d multiply the VAERS deaths by is 8.3333 — to correct for underreporting.
Another estimate of underreporting is from Kostoff et al. who found a best-case scenario is that VAERS deaths are underreported by a factor of 20, equivalent to a capture rate of 5%.
VAERS Capture Rate of 12%: At 12% capture, the true, underlying vaccine deaths are one death for every 14,603 doses administered.
VAERS Capture Rate of 5%: At 5% capture, the true, underlying vaccine deaths are one death for every 6080 doses administered.
Bringing Benefits and Harms Together
Up-to-date evidence reveals that vaccines are expected to cause the loss of more lives than they save.
At the extremes, it’d take 196,000 vaccinations just to prevent one death from COVID — but the expected vaccine-associated death (at 1 death per 6080 doses) would mean that vaccines would cause the loss of 32 lives for every life that they save.
If 32 deaths are caused for every life that is saved, then you have a treatment which does a lot more harm than good.
Even using the best-case estimate for NNV (25,000 vaccinated; just to prevent one death), along with the best-case estimate for VAERS capture (12%) — you are still losing almost 2 lives for every life saved.
And that is not even counting that two doses — not one — were needed to get people fully vaccinated. For a vaccine-naive population, getting them fully vaccinated could cause up to 64 deaths for every life saved.
Even using the best-case estimates during this initial phase of getting people fully vaccinated, would still lead to a cost (in terms of life) of almost 4 lives lost for every life saved.
Key Points
Vaccine-induced antibodies (based on wild-type SARS-CoV-2) no longer offer good protection against newer variants — even below 40% VE in some cases
Attack rates for the more lethal variants (against which the vaccine was designed) are now miniscule
Infection fatality rates for currently-circulating COVID variants are no longer significantly higher than they are for seasonal flu
Unadjusted VAERS reports of death are 8.2 per million doses administered, but correcting for underreporting reveals up to 164 deaths per million doses
A million vaccine doses may prevent less than 3 COVID deaths, while causing up to 164 vaccine-associated deaths (over 50 deaths per life saved)
Reference
[4.7% “COVID naive” attack rate during 6-month Pfizer trial] Six Month Safety and Efficacy of the BNT162b2 mRNA COVID-19 Vaccine. From: https://www.medrxiv.org/content/10.1101/2021.07.28.21261159v1.full.pdf
[39% to 84% vaccine effectiveness against post-Alpha COVID variants like Delta] Liu Q, Qin C, Liu M, Liu J. Effectiveness and safety of SARS-CoV-2 vaccine in real-world studies: a systematic review and meta-analysis. Infect Dis Poverty. 2021 Nov 14;10(1):132. doi: 10.1186/s40249-021-00915-3. PMID: 34776011; PMCID: PMC8590867.
[non-Alpha variants: Only 65 recorded deaths from about 65,000 COVID-positives] UK Technical Briefing #5. From: https://assets.publishing.service.gov.uk/government/uploads/system/uploads/attachment_data/file/959426/Variant_of_Concern_VOC_202012_01_Technical_Briefing_5.pdf
[As little as 12% capture by VAERS of underlying Guillain-Barré syndrome] Miller ER, McNeil MM, Moro PL, Duffy J, Su JR. The reporting sensitivity of the Vaccine Adverse Event Reporting System (VAERS) for anaphylaxis and for Guillain-Barré syndrome. Vaccine. 2020 Nov 3;38(47):7458-7463. doi: 10.1016/j.vaccine.2020.09.072. Epub 2020 Oct 7. PMID: 33039207.
[At most 5% capture of underlying deaths by VAERS surveillance] Kostoff RN, Calina D, Kanduc D, Briggs MB, Vlachoyiannopoulos P, Svistunov AA, Tsatsakis A. Why are we vaccinating children against COVID-19? Toxicol Rep. 2021;8:1665-1684. doi: 10.1016/j.toxrep.2021.08.010. Epub 2021 Sep 14. Erratum in: Toxicol Rep. 2021;8:1981. PMID: 34540594; PMCID: PMC8437699.
[8.2 VAERS-reported deaths for every million vaccine doses administered] Lv G, Yuan J, Xiong X, Li M. Mortality Rate and Characteristics of Deaths Following COVID-19 Vaccination. Front Med (Lausanne). 2021 May 14;8:670370. doi: 10.3389/fmed.2021.670370. PMID: 34055843; PMCID: PMC8160119.
[Hub page for online graphics] From: https://OurWorldInData.org/coronavirus