
What 77% of the World Went Through
The 2020 Experience of the Other 77% of the World

If you just focus on what 23% of the people go through, things can seem pretty bad. Good perspective would bring in the experience of the other 77% of the world. A research question could be: Were things bad in 2020?
It depends on whether you included the whole world, or just look at 23% of it. There were 29 regions of the world which had at least 50 million population in 2020. They’ll be listed below.
I made a dot plot for the 29 most-populous ( e.g., 1=China, 2=Indian, etc):
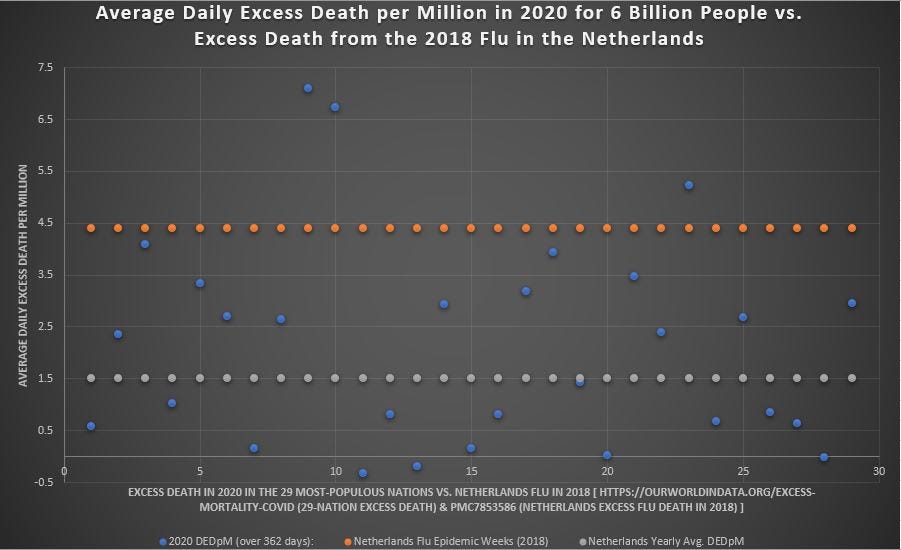
Beginning at lower left, the blue dots show the average daily excess death per million in the largest country (China), the next one (India), and so on, with population dropping with each dot going to the right.
The 29th most-populous region (blue dot at far right) is Colombia, with a population of just over 50 million. Here are data from the World Bank:
===============
Population 2020
Ranking ... Economy ... (thousands)
1 ... China ... 1,402,112
2 ... India ... 1,380,004
3 ... United States ... 329,484
4 ... Indonesia ... 273,524
5 ... Pakistan ... 220,892
6 ... Brazil ... 212,559
7 ... Nigeria ... 206,140
8 ... Bangladesh ... 164,689
9 ... Russian Federation ... 144,104
10 ... Mexico ... 128,933
11 ... Japan ... 125,836
12 ... Ethiopia ... 114,964
13 ... Philippines ... 109,581
14 ... Egypt, Arab Rep. ... 102,334
15 ... Vietnam ... 97,339
16 ... Congo, Dem. Rep. ... 89,561
17 ... Turkey ... 84,339
18 ... Iran, Islamic Rep. ... 83,993
19 ... Germany ... 83,241
20 ... Thailand ... 69,800
21 ... France ... 67,392
22 ... United Kingdom ... 67,215
23 ... Tanzania ... 59,734
24 ... Italy ... 59,554
25 ... South Africa ... 59,309
26 ... Myanmar ... 54,410
27 ... Kenya ... 53,771
28 ... Korea, Rep. ... 51,781
29 ... Colombia ... 50,883
World ... 7,752,841 (7.8 billion)
===============
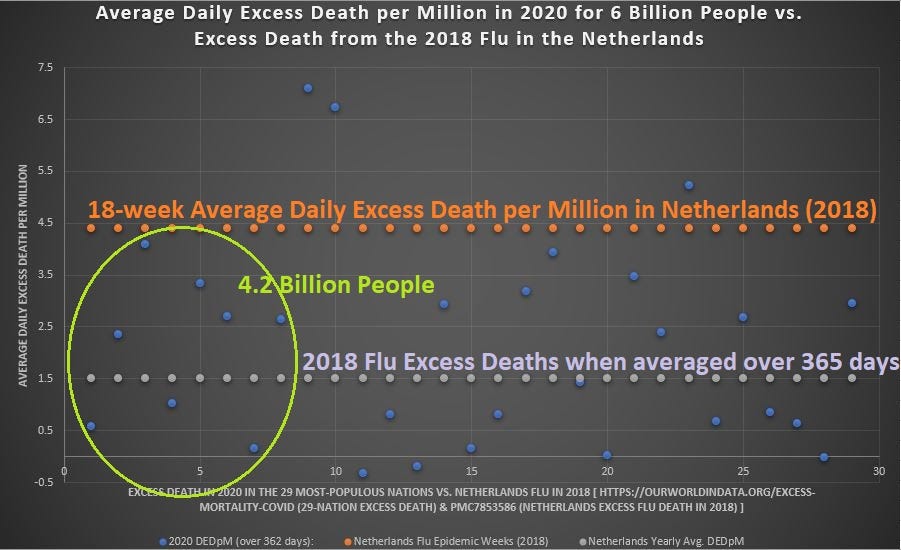
And here is the same chart with notation, showing that most of the world did NOT go through something worse than the worst-ever flu in 2020, as exemplified by the flu experience in the Netherlands from January to April of 2018:
Reference
[Estimated cumulative excess deaths during COVID-19 per 100k people; ending on 28 Dec 2020] — OWID. https://ourworldindata.org/excess-mortality-covid
[9373 excess deaths in 18 epidemic weeks in early 2018, when population was 17.04 million] — van Asten L, Harmsen CN, Stoeldraijer L, Klinkenberg D, Teirlinck AC, de Lange MMA, Meijer A, van de Kassteele J, van Gageldonk-Lafeber AB, van den Hof S, van der Hoek W. Excess Deaths during Influenza and Coronavirus Disease and Infection-Fatality Rate for Severe Acute Respiratory Syndrome Coronavirus 2, the Netherlands. Emerg Infect Dis. 2021 Feb;27(2):411-420. doi: 10.3201/eid2702.202999. Epub 2021 Jan 4. PMID: 33395381; PMCID: PMC7853586. https://www.ncbi.nlm.nih.gov/pmc/articles/PMC7853586/