

What "bad flu" looks like
What "bad flu" looks like
And how it compares to COVID in USA and in Sweden

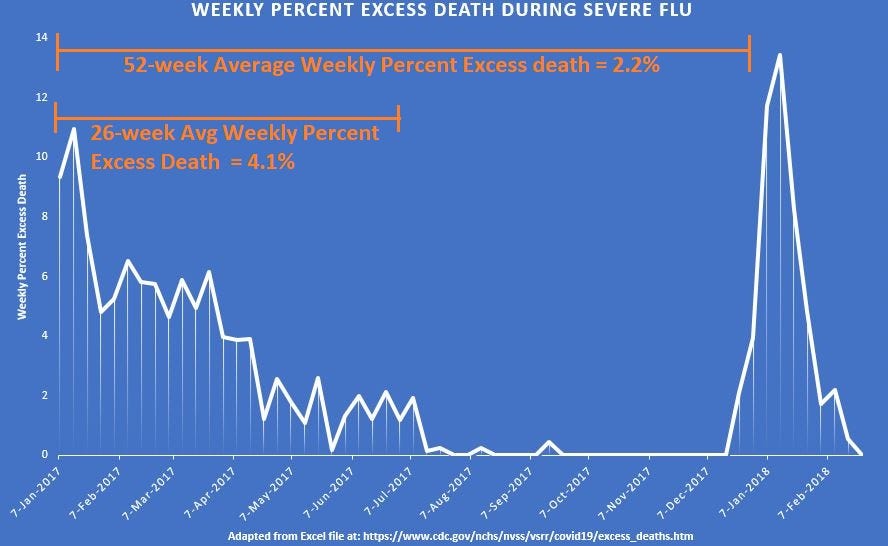
Benchmarks are great things to have because they can put things into perspective. A benchmark for average weekly percent excess death during a severe season of flu would be useful for comparison. Here is what “bad flu” looks like in terms of weekly excess death:
[click image to enlarge]
For a 6-month flu season, it is possible to sustain an average weekly percent excess death rate of about 4% excess death. The average weekly excess for the year was 2.2%. One of the worst flu experiences was in The Netherlands in 2018 though, when the 52-week average of weekly excess death was 6%.
Let’s superimpose “bad flu” on top of some good weeks for Sweden in 2020:
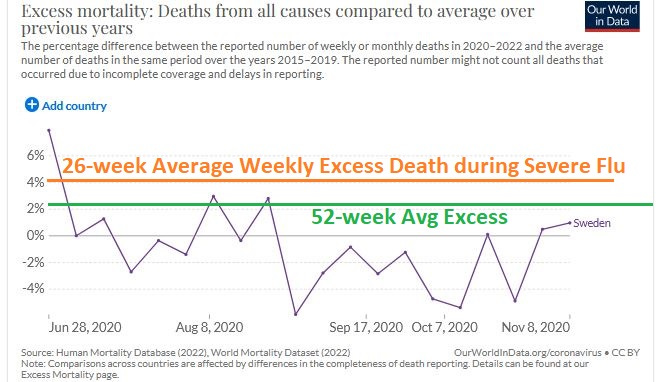
The orange line is the average weekly excess death which was sustained in the USA for 6 months in 2017. The green line is the average weekly excess sustained for an entire year. For most weeks in the last half of 2020, Sweden was doing as good or better than the USA under severe flu.
But let’s add USA to this graph once …

Disturbingly, the weekly excess death in the USA during those very same weeks was always more than 3 times the 6-month average of 2017 — reaching up to almost 7 times as high in the peak on the left (for the week of 26 Jul 2020).
But COVID was never 7 times worse than severe flu. At its worst, COVID approached being twice as bad though.
A really bad flu (e.g., 2014/15 and 2017/18) has an infection fatality rate (IFR) of 0.14%. At its worst, COVID never surpassed an IFR of 0.28% though. Here is a computer simulation of the IFR for a particularly-nasty variant of COVID, the Alpha variant:

[click image to enlarge]
If COVID was never more than twice as bad as flu though, then how come excess deaths were up to 7 times as much as is seen with severe flu? The math does not add up.
Reference
[excess weekly deaths from 2017 going forward] — CDC. https://www.cdc.gov/nchs/nvss/vsrr/covid19/excess_deaths.htm
[excess death compared to average of 2015-2019] — OWID. https://ourworldindata.org/excess-mortality-covid
[As of 19 Jan 2021, from 52,000 COVID infections with Alpha (SGTF) variant, there were 104 deaths by Day 28 (corrected to 117 total deaths, by using Linton et. al., leads to an IFR = 0.225%)] — Page 3. Epidemiological findings. UK Technical Briefing #5. https://www.gov.uk/government/publications/investigation-of-novel-sars-cov-2-variant-variant-of-concern-20201201
[Because Linton et al. showed that 89% of all COVID deaths occur by Day 28, then 11% more is expected, giving rise to 117 total deaths from 52,000 Alpha infections: IFR = 0.225%] — Linton NM, Kobayashi T, Yang Y, et al. Incubation Period and Other Epidemiological Characteristics of 2019 Novel Coronavirus Infections with Right Truncation: A Statistical Analysis of Publicly Available Case Data. Journal of Clinical Medicine. 2020 Feb;9(2). DOI: 10.3390/jcm9020538. PMID: 32079150; PMCID: PMC7074197. https://www.ncbi.nlm.nih.gov/pmc/articles/PMC7074197/
[average daily excess death during 2018 in the Netherlands was 1.5 per million; peak daily death for the worst week (Week 10) was 9.9 per million] — van Asten L, Harmsen CN, Stoeldraijer L, Klinkenberg D, Teirlinck AC, de Lange MMA, Meijer A, van de Kassteele J, van Gageldonk-Lafeber AB, van den Hof S, van der Hoek W. Excess Deaths during Influenza and Coronavirus Disease and Infection-Fatality Rate for Severe Acute Respiratory Syndrome Coronavirus 2, the Netherlands. Emerg Infect Dis. 2021 Feb;27(2):411-420. doi: 10.3201/eid2702.202999. Epub 2021 Jan 4. PMID: 33395381; PMCID: PMC7853586. https://www.ncbi.nlm.nih.gov/pmc/articles/PMC7853586/