
Word Forensics
Post #1504

With the release of a large tranche of the Epstein Files, renewed interest has arisen regarding the “conspiracy theory” of PizzaGate, where elites such as John Podesta are thought to be using the very same online code that self-proclaimed pedophiles use on 4Chan and 8Chan: a code that uses pizza references for sexual subjects.
But proper analytics can help. This post only sets the stage for such analysis. By laying out what counts as impactful even before attempting the research, it protects against the charge of data-dredging (i.e., being guilty of sifting through data “until” something significant is found).
Frequency of Search Terms
It is easy to see when the PizzaGate scandal first took off:
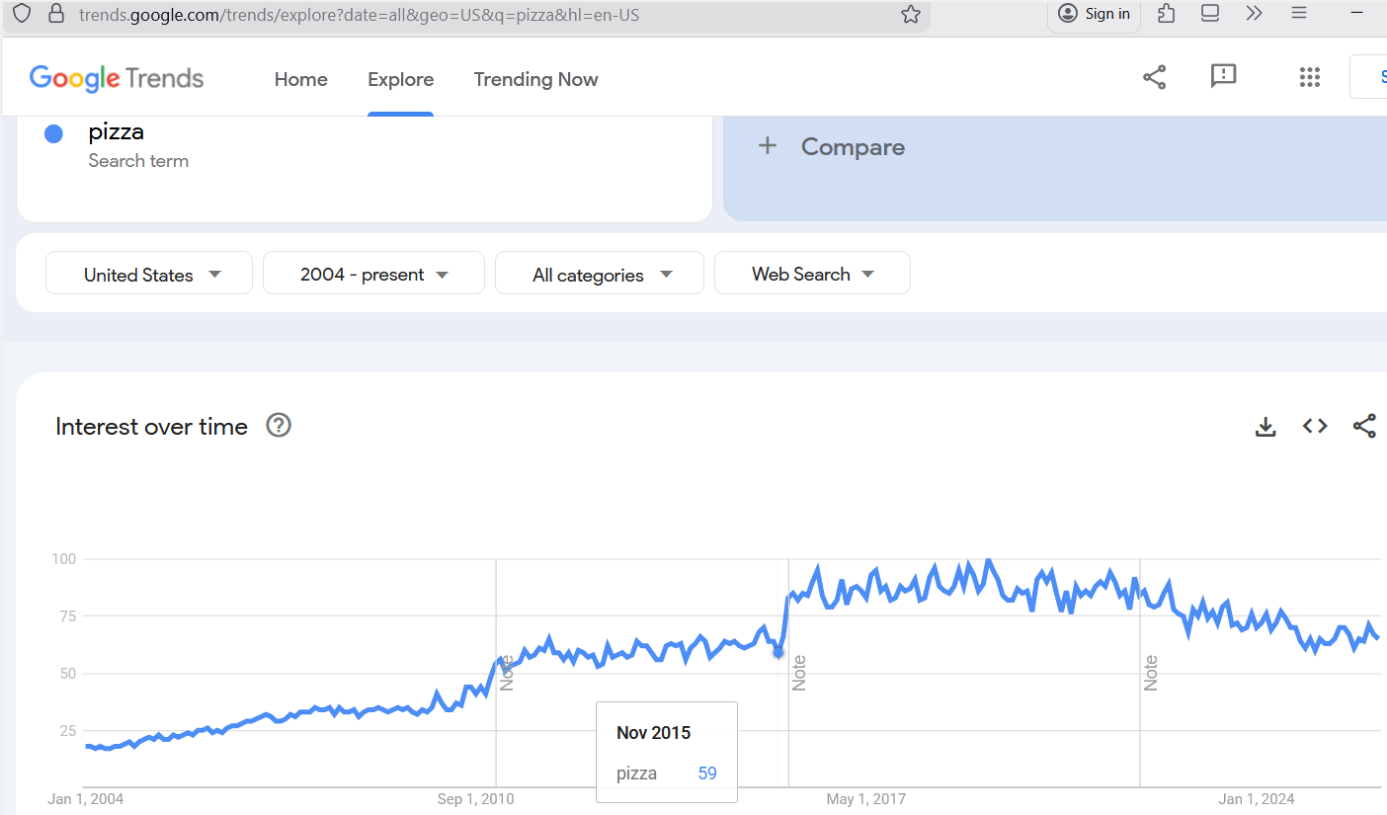
After Nov 2015, the big jump indicates the PizzaGate scandal taking off, on what was then called Twitter (now X).
Frequency of Written Words
When using the English language, the word “pizza” comprises less than 0.0006% of written words (less than 6 words per million):
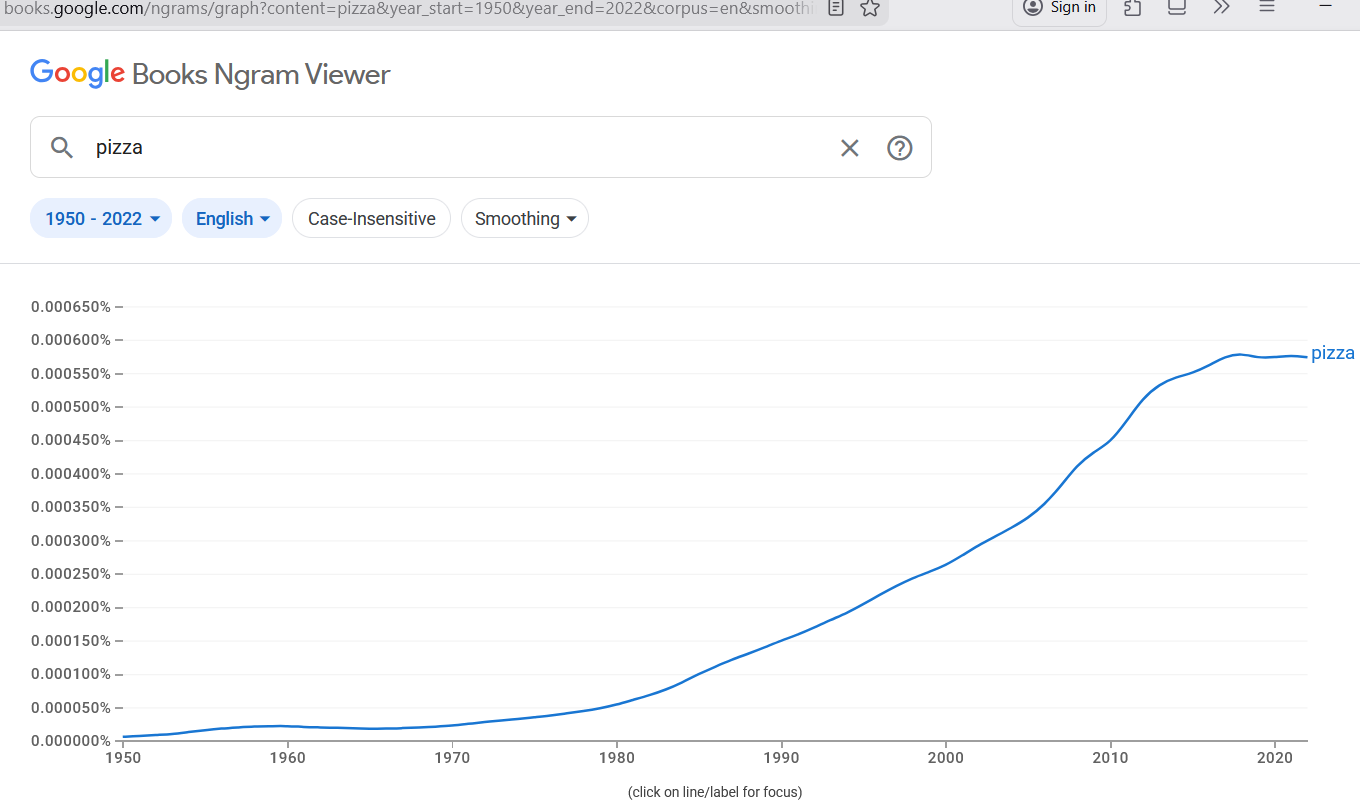
While the average (mean) rate that you see pizza show up in written English is 6 per million words, a reasonable approximation of the standard deviation of the rate is somewhere around 50% of the mean rate:
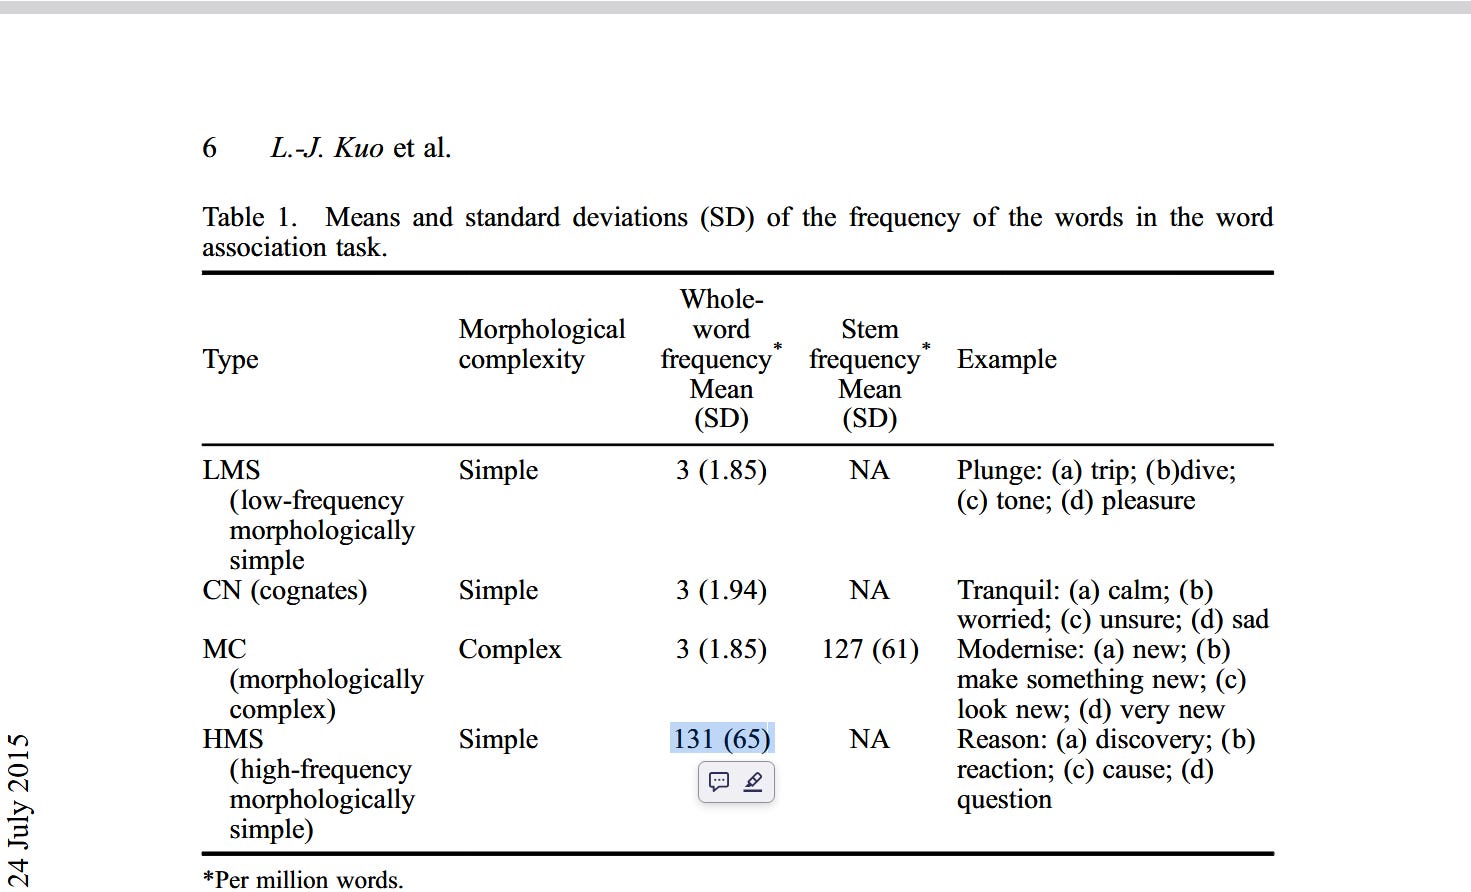
This means that, if you find a rate 50% larger (9 words per million), then that’s 1 standard deviation above the mean. If analysis reveals that pizza is found to comprise more than 0.0015% of written words — or 15 words per million; aka 3 standard deviations above the mean — then that would suggest possible nefarious use of pizza.
The standard of word frequency would be the most-used word in the English language:
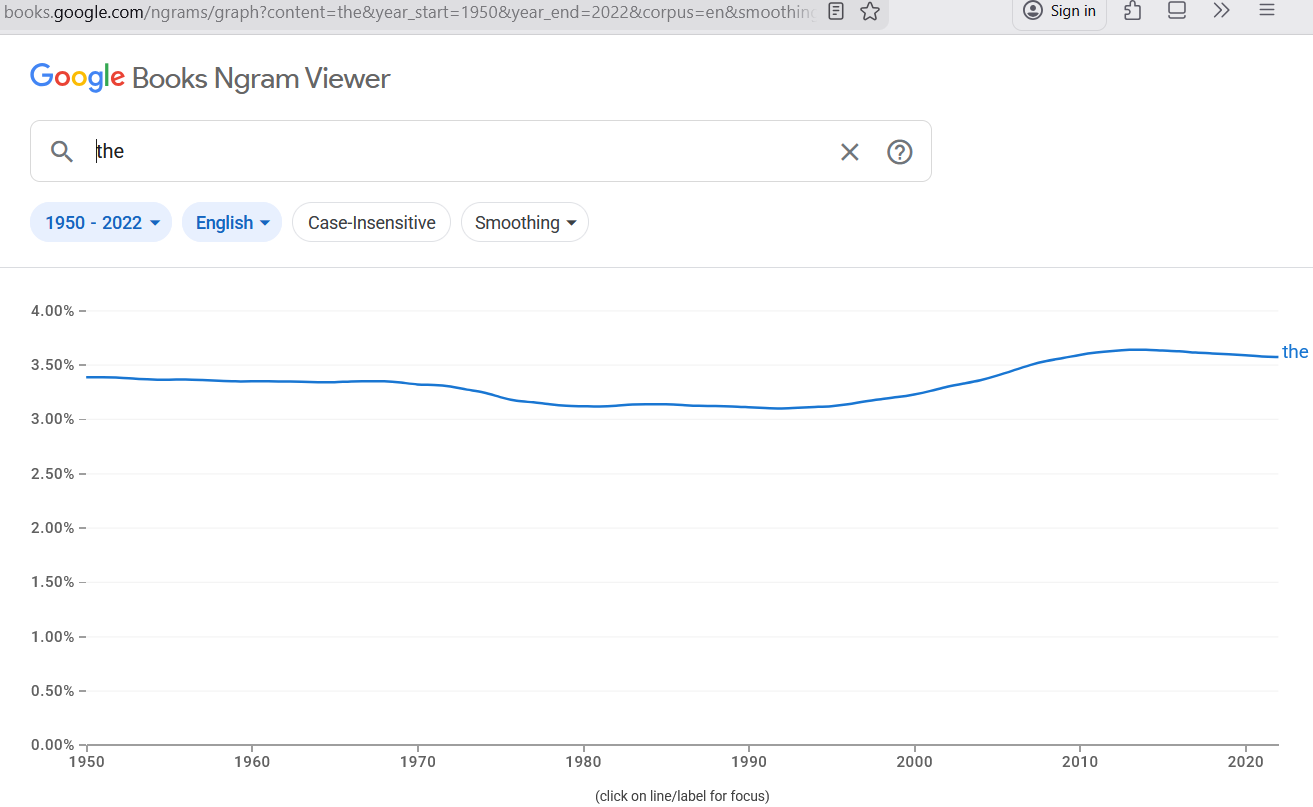
The word “the” comprises ~3.6% of all written words (1 in every 28 written words).
Frequency of Spoken Words
Although the use of the word “the” appears to be higher when looking at spoken English (linguistics) vs. written English (literature):
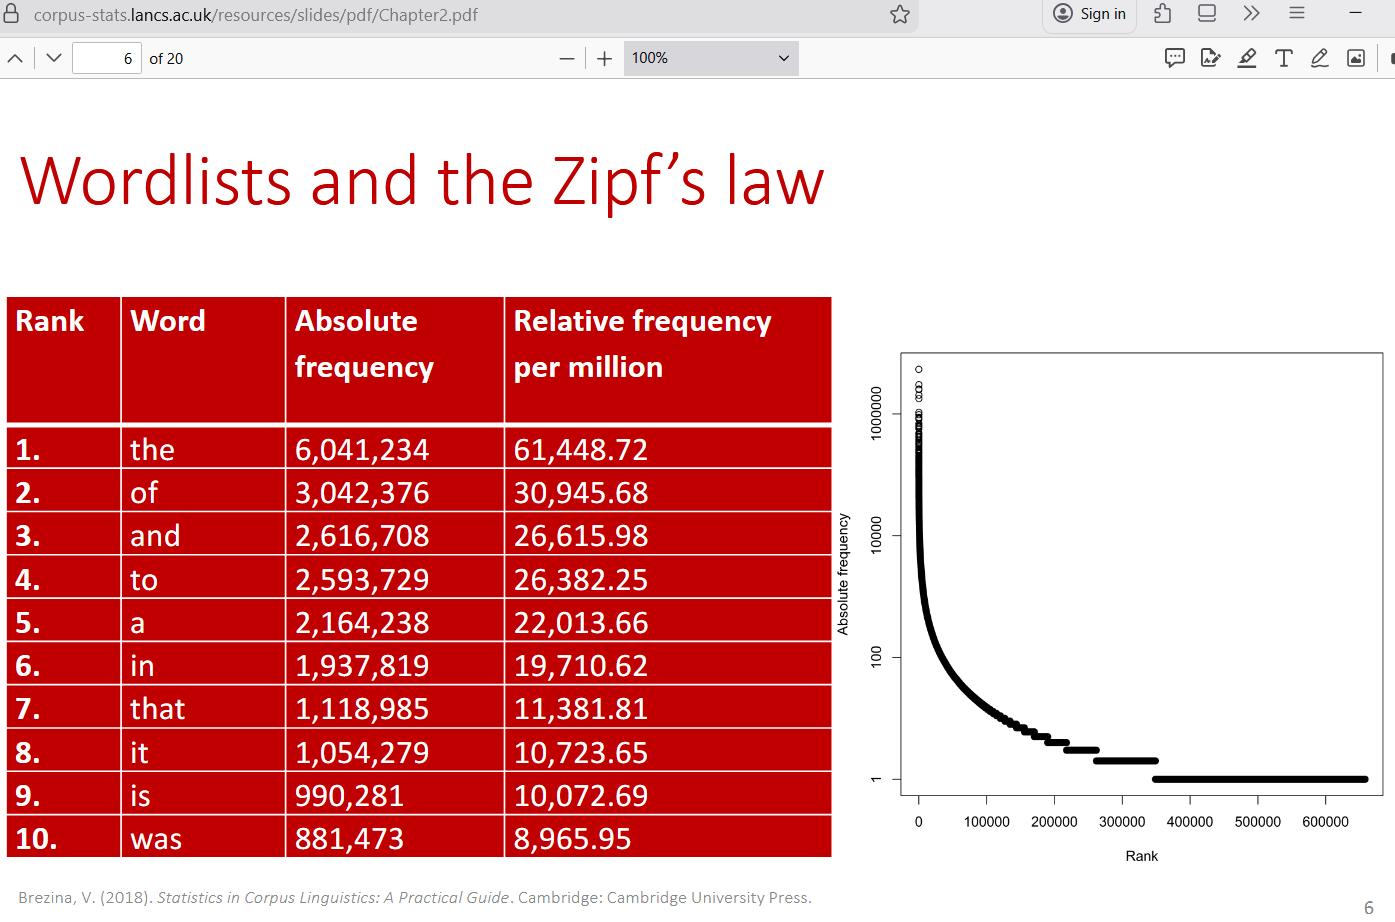
The word “the” got used ( 6.1% vs. 3.6% = ) 1.7 times more frequently when speaking vs. writing, so a sensitivity analysis can be performed by treating the Epstein emails as if they were verbal dialogue, and using a correction factor of 1.7x to represent the expected rate of ‘pizza-word-use’ when engaged in verbal dialogue with someone.
That rate, after correction for use in verbal dialogue, is ( 1.7 * 6 = ) 10 words per million. The new critical threshold level at 3 standard deviations (SD’s) above the mean — assuming 1 SD = 50% of the mean — becomes 25 words per million. If Epstein emails contain “pizza” at a rate higher than 25 words per million, then that would be suspect.
To be clear, when people say “pizza” more than 25 times for every million words, it does not automatically make them out to be a pedophile, even though it is statistically rare, but, in the context of other suspicious data such as photos of underage persons, such a finding should substantially raise the level of one’s suspicion.
A High Bar for Conclusive Justification
A final sensitivity analysis can involve tossing out the assumption that the frequency of word use follows a normal, bell-shaped distribution. This last verification of significant findings then relies on Chebychev Theorem to set the critical threshold for significance: 5 SD’s above the mean. Chebychev applies universally (to everything).
At mean = 10 per million words, 5 SD’s above the mean is 35 per million words.
The 5-SD-standard exhausts the common causes of variation for something. If it is discovered that the use of the word “pizza” in Epstein emails exceeds the rate of 35 per million words, then that would suggest a nefarious use of the word, rather than being the result of the common causes of variation in the use of the word.
Reference
[trends in the use of particular search terms] — https://trends.google.com
[word frequencies using all published books] — https://books.google.com/ngrams/
[rough estimate of standard deviation of word frequency] — The relationship between bilingual experience and the development of morphological and morpho-syntactic awareness: a cross-linguistic study of classroom discourse. October 2015. Language Awareness 24(4):332-354. DOI:10.1080/09658416.2015.1113983.
[word frequency when speaking rather than when writing] — https://corpus-stats.lancs.ac.uk/resources/slides/pdf/Chapter2.pdf