Working-Age Deaths (COVID era vs. World War II)
Weekly Percent Excess Deaths tell an unimaginable story
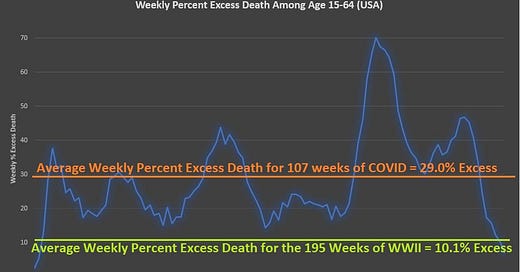
The blue line is the weekly percent excess death during the COVID era among those of working-age in the USA (age 15 to 64). The orange line is the average of the blue line.
When compared to the rate of excess death which is seen during active engagement in World War, COVID-era excess death was almost 3 times as high.
But by September of 2021 — when weekly percent excess death peaked at 70% — the infection fatality rate (IFR) of COVID had decreased down to that of the seasonal flu. The Delta variant in circulation at the time was only 42% as lethal as the Alpha variant it replaced.
Prior to September of 2021, the peak IFR of COVID reached approximately twice as high as seasonal flu. But even if COVID had hypothetically remained twice as bad as flu for all 107 weeks showing, it still doesn’t explain an excess death rate almost three times what is seen during World War.
A bad flu year leads to a 52-week average weekly percent excess of 3% to 6%.
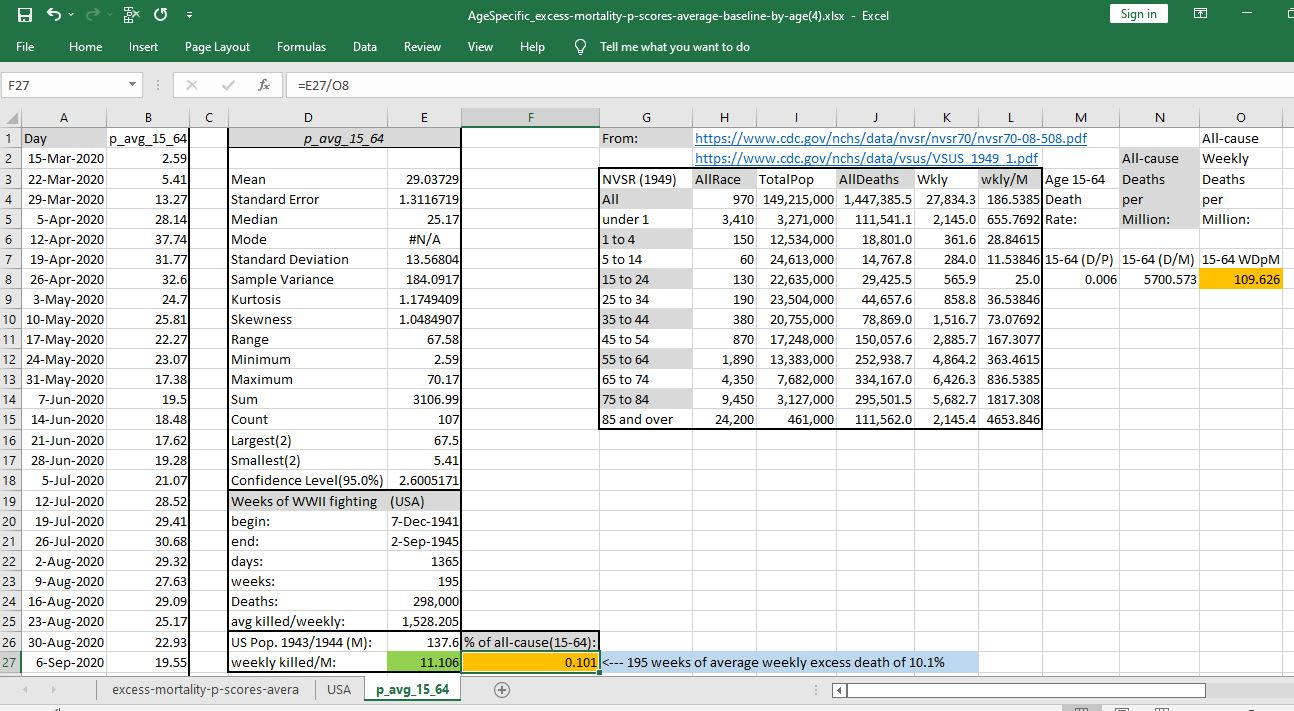
Using the age-structure and age-specific death rates of 1949 as a benchmark, the average weekly excess death of World War II turned out to be 10.1% excess — when weekly all-cause mortality per million of working-age Americans was 110 weekly deaths per million.
But the average weekly percent excess death during the COVID era (29% average excess) in cell E3 in the Excel spreadsheet below is much higher than that:
[click on image to enlarge it]
A respiratory virus which was never more than twice as deadly as the flu most definitely did NOT cause almost 3 times the excess death seen during world wars. The most likely culprit for the excess death among the young is the COVID injections.
While COVID, especially in the young, was never lethal enough to be able to cause 70% excess weekly death (or an average weekly excess of almost 30%), an experimental injection is something which could possibly be that lethal in the young.
Reference
[weekly percent excess death by age group] — OWID. https://ourworldindata.org/grapher/excess-mortality-p-scores-average-baseline-by-age
[WWII losses for USA of 298,000 deaths during 195 weeks of fighting; when US population was 137.6 million] — Encyclopedia Britannica. https://www.britannica.com/event/World-War-II/Costs-of-the-war
[age-specific (working-age) death rates in 1949 in the USA] — CDC. Vital Statistics of the United States, 1949. https://www.cdc.gov/nchs/data/vsus/VSUS_1949_1.pdf
[From ~700,000 cases confirmed by sequencing, Delta variant was 42% as fatal as Alpha] — Table 3. Number of confirmed and probable cases by variant as of 11 October 2021. UK Technical Briefing #25. https://www.gov.uk/government/publications/investigation-of-sars-cov-2-variants-technical-briefings
[what a really bad flu year looks like: 2018 in The Netherlands (average weekly 6% excess)] — van Asten L, Harmsen CN, Stoeldraijer L, Klinkenberg D, Teirlinck AC, de Lange MMA, Meijer A, van de Kassteele J, van Gageldonk-Lafeber AB, van den Hof S, van der Hoek W. Excess Deaths during Influenza and Coronavirus Disease and Infection-Fatality Rate for Severe Acute Respiratory Syndrome Coronavirus 2, the Netherlands. Emerg Infect Dis. 2021 Feb;27(2):411-420. doi: 10.3201/eid2702.202999. Epub 2021 Jan 4. PMID: 33395381; PMCID: PMC7853586. https://www.ncbi.nlm.nih.gov/pmc/articles/PMC7853586/


