

Working Age Excess Death in the UK
Working Age Excess Death in the UK
Third nation with disturbing trend

In previous Substacks here and here, I looked at weekly excess death in the non-elderly in New Zealand and Austria, respectively, showing that they’ve been on the rise for over 3 years straight. But this Substack will add more depth to the analysis.
Potential Criticisms
A potential criticism regarding the first two Substacks may be that the average of 2015-2019 was utilized in order to obtain excess deaths each time. This criticism makes the presumption that something happened within a year or two which alters the expected weekly death counts going forward.
Critics and detractors who argue against the 2015-2019 standard of weekly death counts then move to suggest that the baseline should be a rolling one, stepping forward by a year each year. But that reasoning is shoddy in that the history of movement in weekly death counts shows that big changes do not happen inside of a few years.
More importantly, their reasoning undercuts the purpose of the entire enterprise of “excess death recording” in the first place. Excess deaths aren’t just a number, and there is a good reason to track them. But if, each time a rise is seen, it moves the goalpost for the future, then you get an undetected ratcheting-up effect of unrecorded excess.
Playground Analogy
Imagine playground rules that say that hitting other kids once is bad, and the kids who hit others get punished. But then the school superintendent gets the bright idea to only record hits as being “excessive” if they exceed the number of kids hitting other kids in the previous 5 days.
What happens?
Seriously. Think it through.
What happens is that the 5-day baseline begins to rise over time, as soon as kids realize that they are not being punished for bad behavior that does not “signficantly” exceed the bad behavior of the prior 5 days.
But the original purpose of the rule was to prevent harm, to aim for an optimal situation — and the same thing is true for excess death recording. The true purpose of excess death recording is not to find out what is unusual, given some prior time window, it is to find out what is suboptimal.
When excess death recording is normative rather than descriptive, it remains “fit-for-purpose.” When the baseline years include periods of poor management of public health, such as was seen during COVID, they are “distorted by past mortality peaks” — as a group of researchers who are cited below conveyed.
That leads right into the raw data for weekly excess death in the non-elderly in the UK:
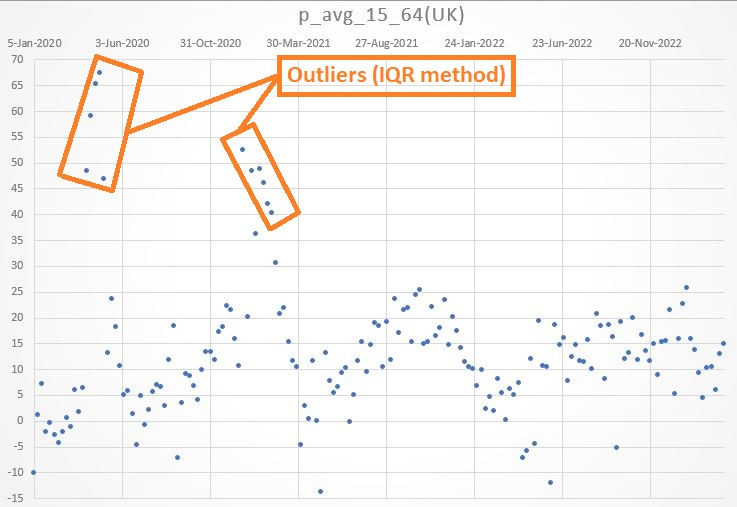
Notice how 11 weeks stand out. One way to address outliers is to just remove them, leaving other data occurring around the same time in place. But the method I used in order to deal with them is to simply shift the entire time window forward.
This forward shift erases all of the variability seen in 2020, and shows only the more recent effects on weekly death:

For the most-recent two years, weekly excess death in the non-elderly in the UK has been on the rise, rising on average by an extra 1% weekly excess every 25 weeks.
The primary thing that is different in the UK for these final 24 months of data is that most people had been given a COVID jab. This fact makes the COVID jab “suspect #1” when attempting to find the major reason(s) for the rise in excess death among the non-elderly.
A full-pause on all experimental COVID injections is warranted by the data.
Reference
[the 2nd lowest weekly death count of the prior 5-7 years is a good (fit-for-purpose) excess death standard] — Shkolnikov VM, Klimkin I, McKee M, Jdanov DA, Alustiza-Galarza A, Németh L, Timonin SA, Nepomuceno MR, Andreev EM, Leon DA. What should be the baseline when calculating excess mortality? New approaches suggest that we have underestimated the impact of the COVID-19 pandemic and previous winter peaks. SSM Popul Health. 2022 Jun;18:101118. doi: 10.1016/j.ssmph.2022.101118. Epub 2022 May 6. PMID: 35573866; PMCID: PMC9075981. https://www.ncbi.nlm.nih.gov/pmc/articles/PMC9075981/
Well done. Gives a very good picture of what the data reveals.