

Total vs. J-coded Pneumonia & Influenza
Total vs. J-coded Pneumonia & Influenza
Post #804

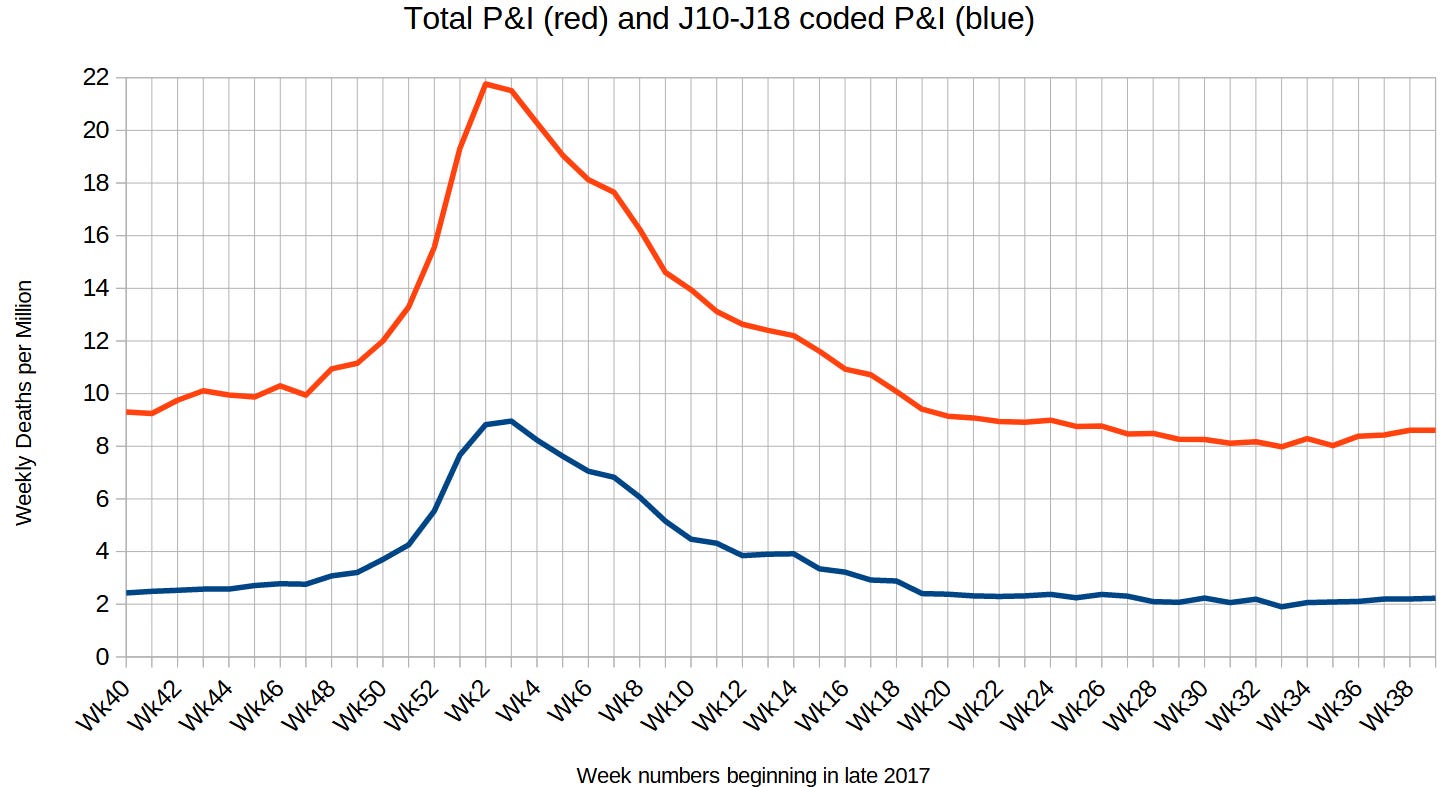
Of all of the pneumonia and influenza (P&I) deaths that occur, there appears to be a 75% discrepancy between those receiving the international classification of disease (ICD) J-codes and CDC’s “FluView” weekly death totals. Here are weekly P&I death rates per million for Week 40 of 2017 through Week 39 of 2018:
Only the particular J-code, J12, seems able to directly attribute a pneumonia to the flu (or other virus), because the closest-named species, Hemophilus influenzae, is actually a bacterium:

Assuming the higher weekly death rates are more correct — and that the rate from those receiving J-codes “undercounted” pneumonia and influenza deaths by 75% — you end up with this graph:

The red line comes from a proposed normative method of computing excess deaths, where the best 13 weeks out of the year are used as the baseline, and everything else is unjustified excess death coming from seasonal fluctuation, which is boldly interpreted as if it should not even be present. This means everything above the red line is excess.
NOTE: Using the 25th percentile (as done above) involves the maximum of the lowest 13 weeks instead of the average (as proposed) of the lowest 13 weeks. The 25th percentile is a more conservative method than averaging the best 13 weeks in a year.
When applied to a population of 336 million (~Feb 2024; USA), it represents 48,500 excess P&I deaths in those 52 weeks showing. Again, this normative process of excess death computation presumes that wild swings in weekly deaths due to seasonal fluctuation are unjustified.
This means that the seasonal excesses can get explained away, such as being due to things such as “fully-preventable seasonally-insufficient vitamin D” — or FPSIVD, for short. It means that over 40,000 people from 2017-2018 did not have to die from pneumonia & influenza (their deaths were fully preventable), but they did, anyway.
Related posts are available here and here.
Reference
[CDC P&I deaths estimate #1] — https://gis.cdc.gov/grasp/fluview/mortality.html
[CDC P&I deaths estimate #2] — https://data.cdc.gov/NCHS/Weekly-Counts-of-Deaths-by-State-and-Select-Causes/3yf8-kanr
[a normative method for computing excess death] — Shkolnikov VM, Klimkin I, McKee M, Jdanov DA, Alustiza-Galarza A, Németh L, Timonin SA, Nepomuceno MR, Andreev EM, Leon DA. What should be the baseline when calculating excess mortality? New approaches suggest that we have underestimated the impact of the COVID-19 pandemic and previous winter peaks. SSM Popul Health. 2022 Jun;18:101118. doi: 10.1016/j.ssmph.2022.101118. Epub 2022 May 6. PMID: 35573866; PMCID: PMC9075981. https://www.ncbi.nlm.nih.gov/pmc/articles/PMC9075981/