In this prior Substack, using excess death data from The Economist (from OWID website) I explored the statistical significance of increases in the accrual rate of excess death after COVID jabs rolled out. But extending the cutoff date for “early adopter” by just one day included two more nations which increased the significance of the findings by a lot.
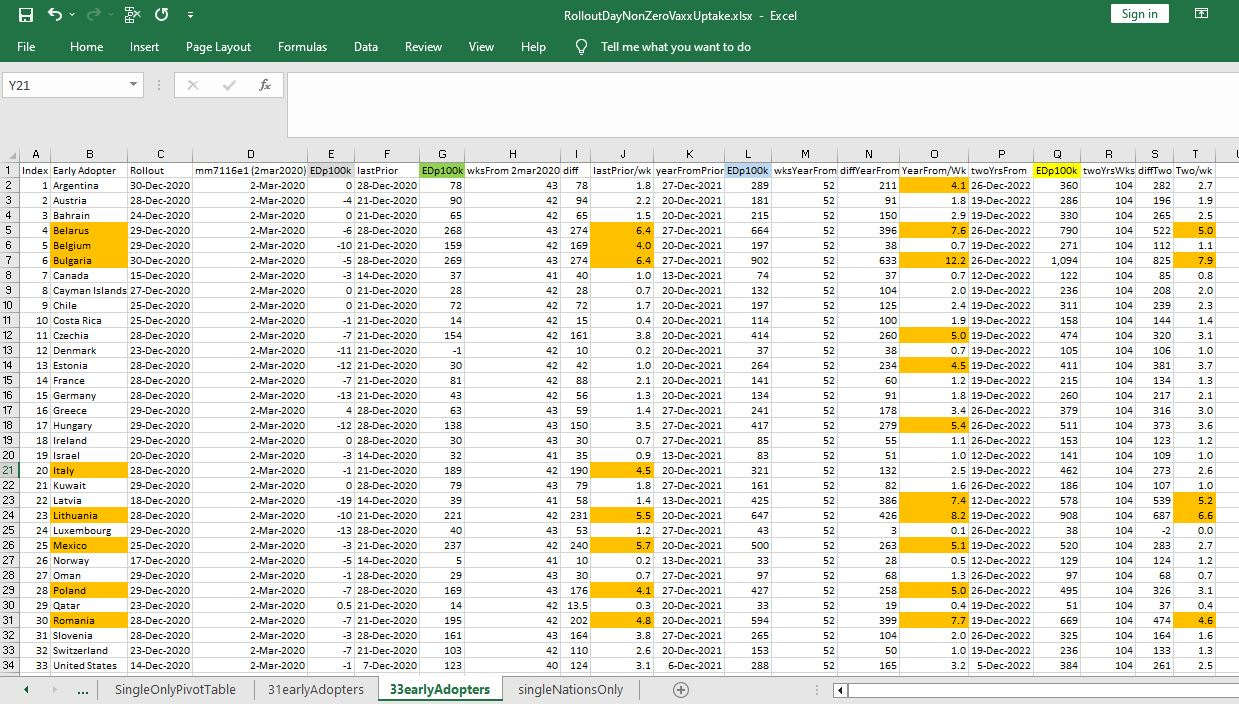
Here are the Excel spreadsheet notes:
[click to enlarge]
Key:
Gray header: accumulation of excess death per 100,000 by 2 Mar 2020
Green header: accumulation of excess death by last week before jab rollout
Blue header: accumulation of excess death by 12 months past rollout
Yellow header: accumulation of excess death by 24 months past rollout
Experience from past flu seasons cited in the previous Substack reveal that severe flu can cause an average weekly excess death accrual rate of about 1.0 per 100,000 — leading to an annualized accrual of 52 excess deaths per 100,000.
The orange cells indicate accrual rates at least 4 times what is seen with severe flu. In 5 places at far right (column T), you see that “quadruple-flu” excess death even when viewing a 24-month time-window post-rollout.
In those places, “COVID + COVID jab” was more than 4 times worse than severe flu. But on its worst day, COVID was never even 3 times worse than severe flu, and from Jan 2022 forward, only the mild variant, Omicron, has predominated.
Omicron isn’t even half as bad as median flu, let alone severe flu.
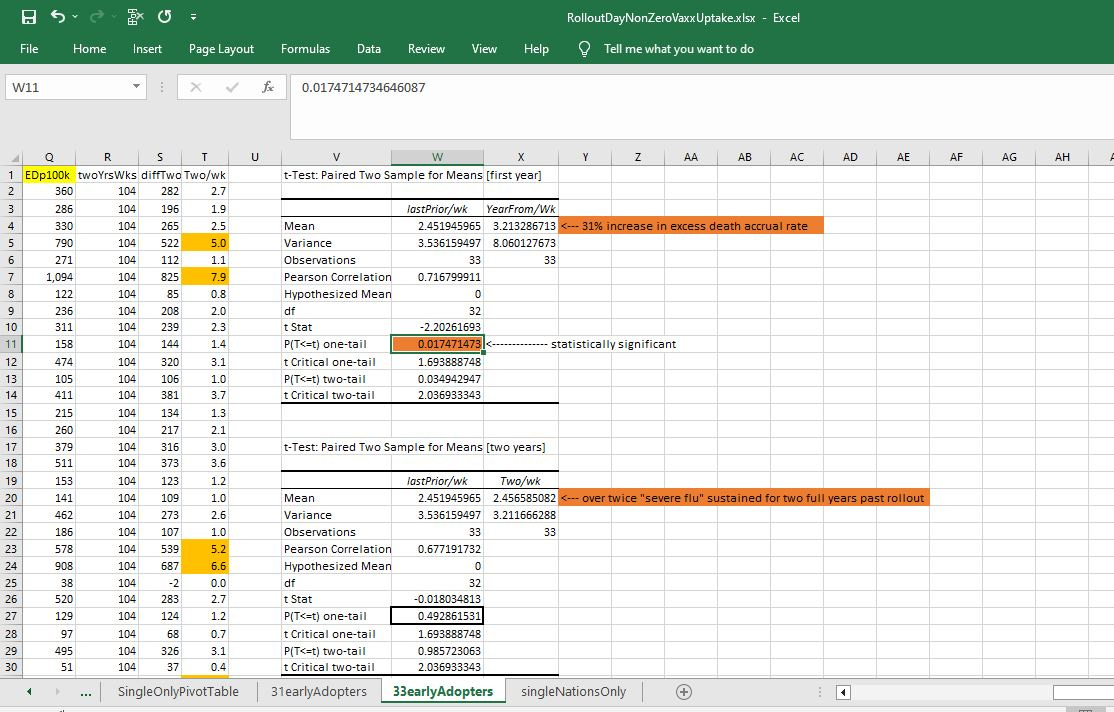
This indicates that the reason for the sustained excesss death is the COVID jab, and not COVID. Formal statistical tests were performed on the data, revealing statistical significance for the first full year after jab rollouts, and equivalence for the first 24 months after jab rollouts:
[click to enlarge]
The p-value for the increase in the accrual rate of excess death after jab rollouts shows up at very top — indicating that the 31% increase in average weekly excess death rates after rollouts was statistically signficant.
The comparison of pre-jab to a full 24 months post-jab shows equivalence. In other words, the excess death rate prior to jabs (which had been over twice that seen with severe flu) remained throughout two full years of the widest “vaccine” campaign that the world has ever seen.
Even given two full years to work, there is no evidence whatsoever that COVID jabs cut excess death — compared to the accrual rate found before jab rollouts.
Average Weekly Accrual Rate of Excess Death per 100,000
Time Window ………….…. Rate
pre-jab: ………………………….. 2.45
12 months post-jab: ….…. 3.21
24 months post-jab: …….. 2.46
References
[weekly accumulation of excess death per 100,000] — The Economist. OWID. https://ourworldindata.org/excess-mortality-covid
[average daily excess death during 2018 in the Netherlands was 1.49 per million; when 9373 excess deaths were found and population was 17.23 million] — van Asten L, Harmsen CN, Stoeldraijer L, Klinkenberg D, Teirlinck AC, de Lange MMA, Meijer A, van de Kassteele J, van Gageldonk-Lafeber AB, van den Hof S, van der Hoek W. Excess Deaths during Influenza and Coronavirus Disease and Infection-Fatality Rate for Severe Acute Respiratory Syndrome Coronavirus 2, the Netherlands. Emerg Infect Dis. 2021 Feb;27(2):411-420. doi: 10.3201/eid2702.202999. Epub 2021 Jan 4. PMID: 33395381; PMCID: PMC7853586. https://www.ncbi.nlm.nih.gov/pmc/articles/PMC7853586/


