
Gutted-out Middle Class (part 2)
Post #1239

In this prior post, the evolution of “net debt” was shown for the top 1% and for those up to the 90th percentile. In an effort to recreate the findings of the final chart, I was only able to partially-confirm them. The “net debt” is described as what you owe others after you have subtracted away what others owe you.
Let’s say that 3 people, Peter, Paul, and Mary were finding their financial positions. Paul owed a total of $15 but Peter and Mary owed Paul a total of $10. This would mean that Paul’s “net debt” is $15 - $10 = $5. It represents what he would still owe others in the unlikely scenario that they all immediately had paid up their debt to him.
Here is my attempt to create a “net debt” figure for the middle class:

I took total liabilities in those who are in the 50th-90th wealth percentiles — i.e., the Middle Class — and then subtracted away “what others owed them” in the form of debt securities, loans, and advances. Keep in mind that the Middle Class here is 40% of everyone. Back in the 3rd quarter of 1989, the Middle Class owed $1.36 trillion.
By the 4th quarter of 2024, the Middle Class had net debt of $7.24 trillion:

But we can scale it to the nominal (unadjusted) GDP to see if it went up when put in terms of the net debt of the Middle Class as a percentage of the GDP. Back in 1989, GDP was $5.7 trillion:

And this means that “net debt” of the Middle Class came in at 23.9% of GDP. By 2024, the GDP had risen to $29.7 trillion:

And that made the “net debt” of the Middle Class equivalent to 24.4% of GDP — the debt situation of the Middle Class had worsened over time. Though this worsening is not as big as expected from the prior report, keep in mind that the income growth of the Middle Class also lags behind the income growth of the top 1%, magnifying harm.
Here is the same “net debt” graph for the top 1%:

The first thing to notice is that it is negative, which can be interpreted as the top 1% lending out more money to others than they borrow. In the unlikely scenario where all people in debt to them had paid up immediately, then they would have more than enough cash on hand to pay all of their debts to others.
In 1989, their debt situation in terms of “net debt” meant that others owed them an amount that was worth 10.9% of GDP. By 2024, the share of GDP that was “owed to” the top 1% actually came down to 8% of GDP. While we still owed them much more than they owed us, their “net debt” position didn’t improve from 1989, relative to GDP.
The prior report claimed it improved, but the prior report used 1980 as a baseline, and the data for this report only go back to 1989 — so it is still possible that both reports are right, even though they appear to oppose each other. The main theme still holds true though:
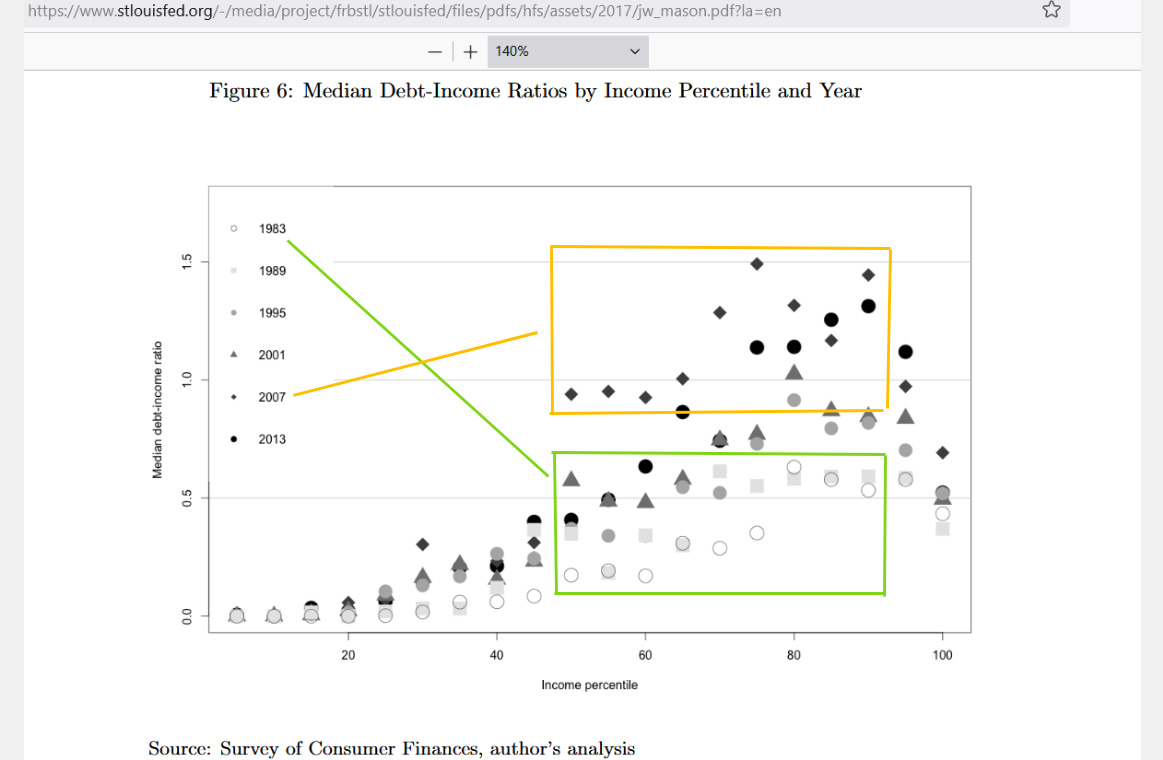
The Middle Class has been hammered, and is worse off today than it was in 1989. Here is a single chart which tells a lot of stories, showing how things were worse for the Middle Class in the year of 2007 (black diamonds inside of orange box), especially when compared to how things were in 1983 (open circles inside of green box):
Reference
Board of Governors of the Federal Reserve System (US), Total Liabilities Held by the 50th to 90th Wealth Percentiles [WFRBLN40073], retrieved from FRED, Federal Reserve Bank of St. Louis; https://fred.stlouisfed.org/series/WFRBLN40073
Board of Governors of the Federal Reserve System (US), Debt Securities Held by the 50th to 90th Wealth Percentiles [WFRBLN40062], retrieved from FRED, Federal Reserve Bank of St. Louis; https://fred.stlouisfed.org/series/WFRBLN40062
Board of Governors of the Federal Reserve System (US), Loans (Assets) Held by the 50th to 90th Wealth Percentiles [WFRBLN40065], retrieved from FRED, Federal Reserve Bank of St. Louis; https://fred.stlouisfed.org/series/WFRBLN40065
Board of Governors of the Federal Reserve System (US), Other Loans and Advances (Assets) Held by the 50th to 90th Wealth Percentiles [WFRBLN40066], retrieved from FRED, Federal Reserve Bank of St. Louis; https://fred.stlouisfed.org/series/WFRBLN40066
U.S. Bureau of Economic Analysis, Gross Domestic Product [GDP], retrieved from FRED, Federal Reserve Bank of St. Louis; https://fred.stlouisfed.org/series/GDP
Board of Governors of the Federal Reserve System (US), Total Liabilities Held by the Top 1% (99th to 100th Wealth Percentiles) [WFRBLT01019], retrieved from FRED, Federal Reserve Bank of St. Louis; https://fred.stlouisfed.org/series/WFRBLT01019
Board of Governors of the Federal Reserve System (US), Debt Securities Held by the Top 1% (99th to 100th Wealth Percentiles) [WFRBLT01008], retrieved from FRED, Federal Reserve Bank of St. Louis; https://fred.stlouisfed.org/series/WFRBLT01008
Board of Governors of the Federal Reserve System (US), Loans (Assets) Held by the Top 1% (99th to 100th Wealth Percentiles) [WFRBLT01011], retrieved from FRED, Federal Reserve Bank of St. Louis; https://fred.stlouisfed.org/series/WFRBLT01011
Board of Governors of the Federal Reserve System (US), Other Loans and Advances (Assets) Held by the Top 1% (99th to 100th Wealth Percentiles) [WFRBLT01012], retrieved from FRED, Federal Reserve Bank of St. Louis; https://fred.stlouisfed.org/series/WFRBLT01012
[Great Recession debt-to-income of Middle Class] — https://www.stlouisfed.org/-/media/project/frbstl/stlouisfed/files/pdfs/hfs/assets/2017/jw_mason.pdf?la=en