

Macronutrients and Obesity

NOTE: Macronutrients provide calories (e.g., protein, carbohydrates, fat)
Dr. Robert Malone recently wrote about the attack on small farmers and the health benefits of getting some good meat in your diet. Human bodies have lived on meat so much so that — though it was costly — it was even given to prisoners (item #5 below) at a rate of one pound per week:
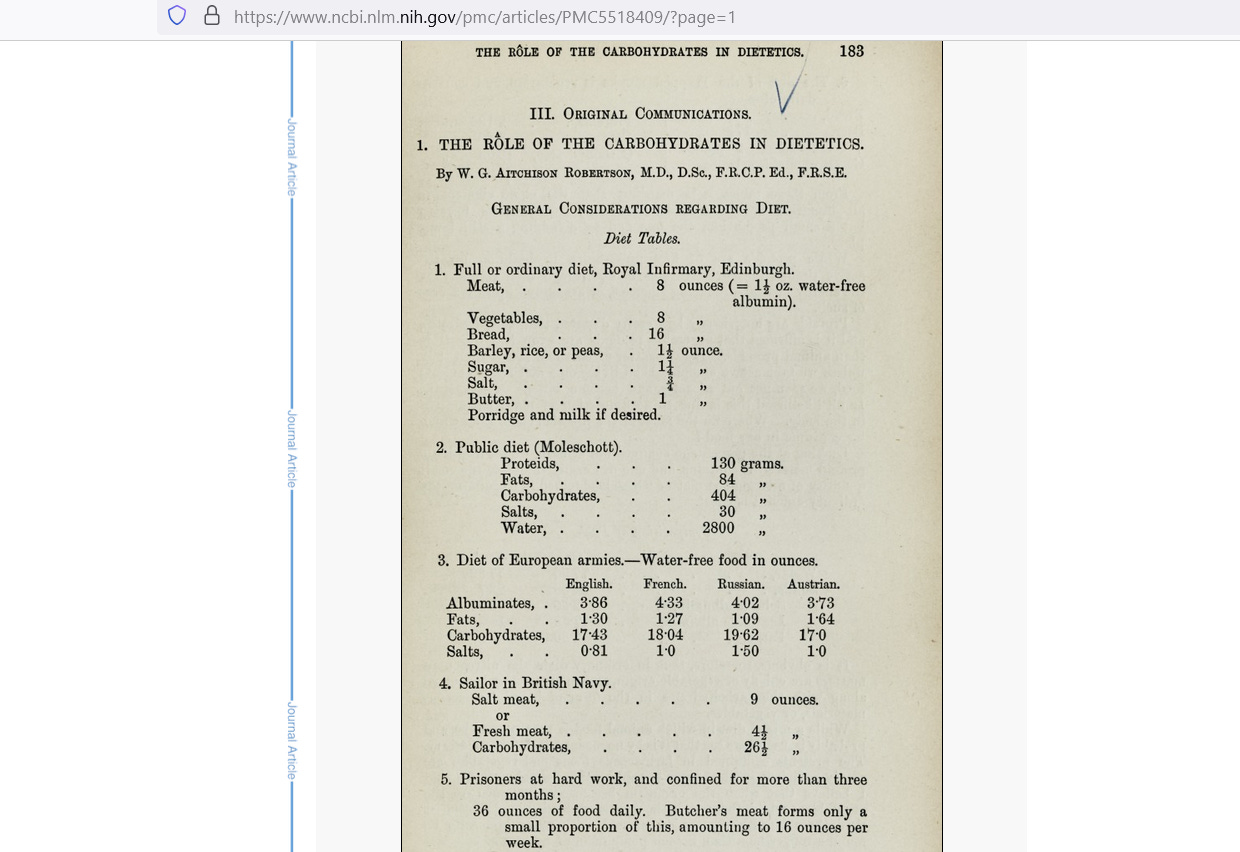
Prison wardens probably discovered that you cannot maintain hard labor if you do not supply meat to prisoners. British sailors got at least 4.5 ounces of meat per day but the grand-daddy of them all were the Scottish military: half a pound of meat per day. That much meat kept the Scottish soldiers strong and sturdy.
In the USA, there was an explosion of obesity from the early 1970s to the early 2000s — the prevalence of obesity tripled. Here is the obesity prevalence for the most-recent 22 years of data:
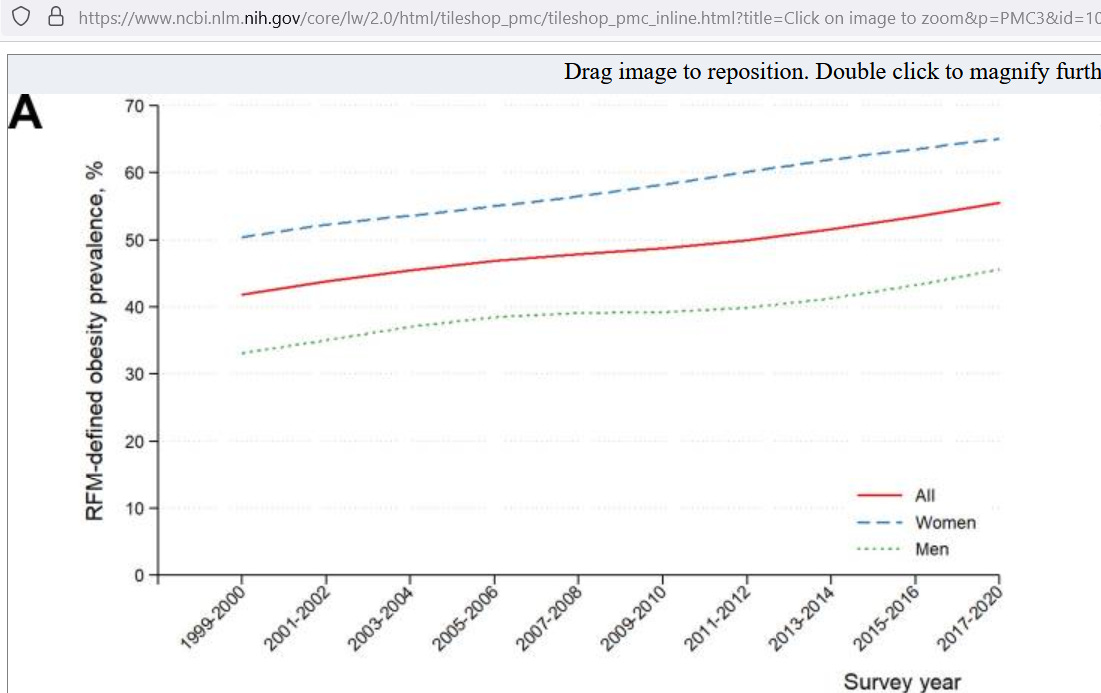
The orange-red line is the overall prevalence, reaching 55% by 2020. This study used the height and waist ratio to estimate body fatness (relative fat mass; RFM) instead of the body mass index, BMI — measured as kilograms of body weight divided by height in meters, squared (kg/m^2), which does more poorly at estimating obesity.
A main reason for the upward trend in obesity is because of the upward trend in carbohydrate intake, and Dr. Malone reveals how industry has been pivotal in causing that upward trend: because carbohydrates are where their profits lie. Here is a comparison of the carbohydrate percentage of all calories between 1970 and 2006:
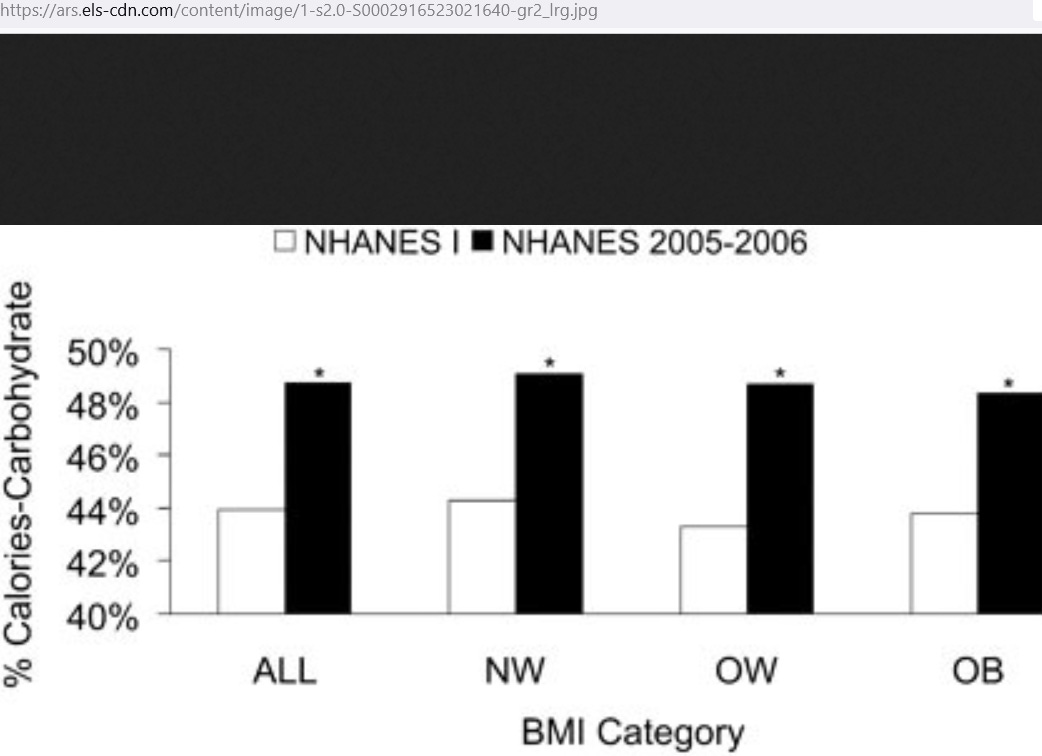
The white bars correspond to the energy percentage of carbohydrates in the very large NHANES I study — from 1971-1975. NW are those of normal-weight, OW are over-weight, and OB are obese, as estimated by the admittedly-poor measure of BMI. Cutoffs for reaching OW and OB were 25 and 30, respectively.
The energy percentage of calories from fat and protein fell over the same period, while obesity tripled — though absolute grams of protein may not have fallen, due to a rise in caloric intake over that period. But, because grams of protein and body weight are so intertwined, the grams of protein per kilogram of body weight likely fell.
Further reading
Deep Stats
To find out if you qualify as being obese, use this RFM formula:
[ % body fat ] = 64 - (20 × height/waist circumference) + (12 × sex); sex equals 0 for men and 1 for women
Women qualify as being obese with 40% body fat; men qualify with 30% body fat. The measuring units don’t matter because both height and waist circumference are inserted as a ratio (so the units cancel).
A 6-foot tall man is 72 inches tall. If his waist at the belly button (just above hipbone) measures 40 inches, then his body fat is estimated by formula at 28% (almost obese).
Reference
[35-year trend in macronutrient intake] — Austin GL, Ogden LG, Hill JO. Trends in carbohydrate, fat, and protein intakes and association with energy intake in normal-weight, overweight, and obese individuals: 1971-2006. Am J Clin Nutr. 2011 Apr;93(4):836-43. doi: 10.3945/ajcn.110.000141. Epub 2011 Feb 10. PMID: 21310830. https://pubmed.ncbi.nlm.nih.gov/21310830/
[22-year trend in relative fat mass estimates] — Woolcott OO, Seuring T. Temporal trends in obesity defined by the relative fat mass (RFM) index among adults in the United States from 1999 to 2020: a population-based study. BMJ Open. 2023 Aug 17;13(8):e071295. doi: 10.1136/bmjopen-2022-071295. PMID: 37591649; PMCID: PMC10441088. https://www.ncbi.nlm.nih.gov/pmc/articles/PMC10441088/
[1896 journal article on diet] — Robertson WGA. The Rôle of the Carbohydrates in Dietetics. Trans Med Chir Soc Edinb. 1896;15:183-213. PMID: 29584126; PMCID: PMC5518409. https://pubmed.ncbi.nlm.nih.gov/29584126/