

Here is the slide in question:

[click to enlarge]
The dotted line up top represents expected death rates over the 42 days post-dose, and the bars below are for deaths by specific causes (e.g., Diseases of the heart, Cerebrovasular diseases, Malignant neoplasms). Notice that the tallest bar in the chart is still only 30% of the death which had been expected to occur in those 42 days.
That would mean that the death rate was cut by 70% from expected. All other measures involved even more than a 70% reduction in death. The shortest bars indicate at least a 95% reduction in death! But how feasible is that?
To find out, let’s examine 21 years of US death data to find out the variability associated. A good start would be to compute a standard deviation of cause-specific death rates by age. And then a good next step is to compute the Coefficient of Variation (the standard deviation as percentage of the mean value).
Here is where I first got the data from:

It’s the final death data for the year of 2019, from the National Vital Statistics Report out of CDC. But look at these 21 years of death rates by age for cancer:
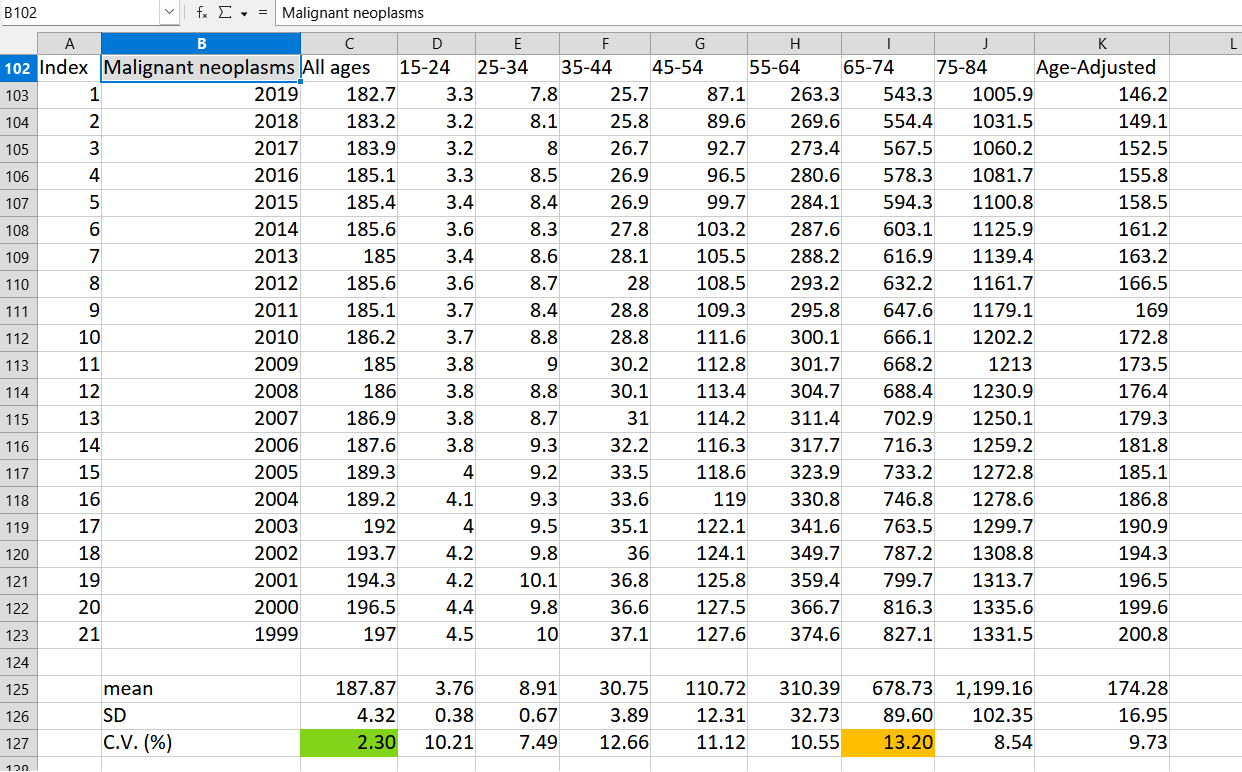
These are all in yearly deaths per 100,000 persons, and when looking at all ages together, one standard deviation was only worth 2.3% of the mean value (green cell; C127). Even the most variable death rate for the age band of 65-74 had a standard deviation that was only 13% of the mean value.
This indicates that, to get a 13% drop in cancer death, you need to drop by one standard deviation. To get a 26% drop would require 2 standard deviations of a drop. To cut a cancer death rate by 39% would require a 3 standard deviation drop (something super unlikely), and to cut death by 52% requires 4 standard deviations.
Notice how we are not even there yet. Adding another 13% onto 52% brings us up to a 65% drop in cancer death — a drop of 5 standard deviations. And we’re still not there! In other words, what the CDC slide is asking you to believe is that COVID shots are so magical that they are capable of cutting death rates more than 5 standard deviations!
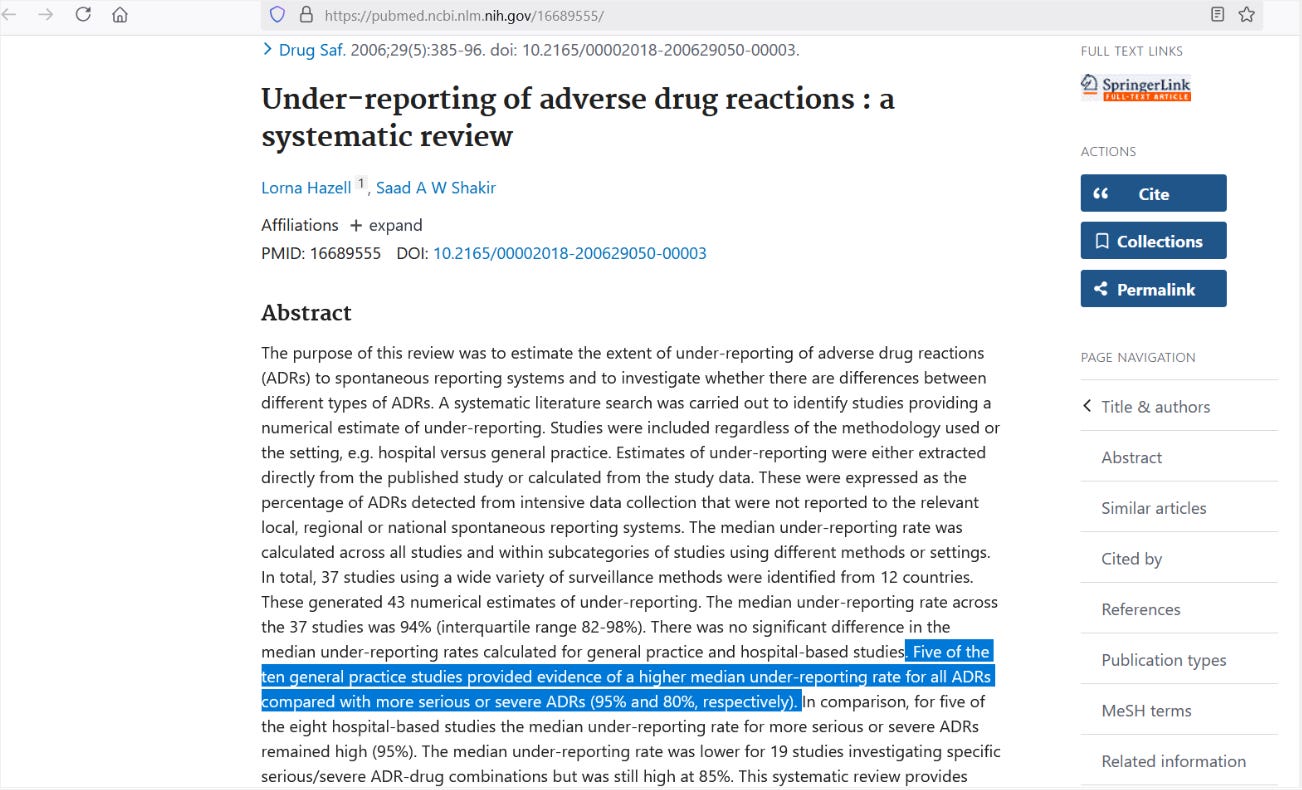
It is unclear if CDC applied a correction for the under-reporting in the VAERS system. The lowest correction to apply comes from spontaneous reporting of serious adverse events (includes death) out of general practices, where only (100 - 80 =) 20% of the serious adverse events occurring in the background actually got reported:
[click to enlarge]
The 80% under-reporting highlighted for serious adverse events indicates that 20% of the events occurring in the background got reported — and it is the highest estimate of capture rates of serious adverse events (it is the least conservative number). If we use it, then that means we need to multiply counted reports by a minimum of 5.
But if reports must be multiplied by a minimum of 5, then that 30% of expected deaths from above — in the age band of 6 months to 17 years — becomes (30 * 5 =) 150% of expected, meaning that COVID shots led to a 50% increase in death rates for them, not a 70% decrease in death rates for them.
Reference
[ACIP meeting slides] — https://www.cdc.gov/acip/downloads/slides-2025-06-25-26/04-Meyer-COVID-508.pdf
[21 years of age-specific death by cause] — https://www.cdc.gov/nchs/data/nvsr/nvsr70/nvsr70-08-508.pdf
[the lowest multiplication factor for spontaneous reporting is 5] — Hazell L, Shakir SA. Under-reporting of adverse drug reactions : a systematic review. Drug Saf. 2006;29(5):385-96. doi: 10.2165/00002018-200629050-00003. PMID: 16689555. https://pubmed.ncbi.nlm.nih.gov/16689555/