

NOTE: an update to this story can be found here.
In this prior Substack, I noted how a minimum expected death rate per 100,000 on an annual basis for those of age 18-39 in England would be 40 per 100,000. Here is that rate, seasonalized, and also including error bars showing 95% confidence — with the actually-reported death rate superimposed in yellow:
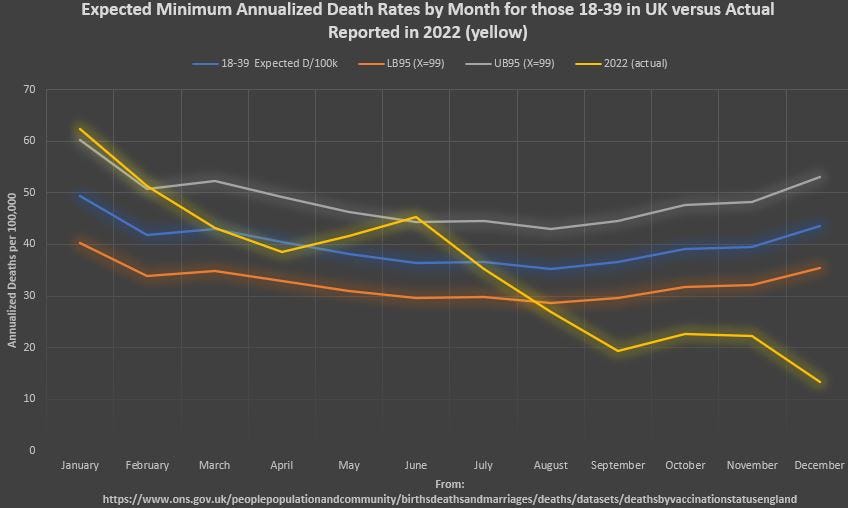
The blue line is the expected death rate for each month, using 40 per 100,000 corrected for seasonality. At bottom right, the tiny death rate in those of age 18-39 is below the lower 95% confidence limit (orange line).
Notably, 4 consecutive months are below the lower limit, which has a tiny probability roughly equivalent to drawing out a red marble 4 times in a row, where there are only 25 red marbles in a jar of 1,000 marbles — and you replace the drawn marble each time.
One explanation for the findings is data fudgery, where UK officials may have “packed-in” excess deaths early on, but then “ran-out-of-room” and were forced to report ultra-low death rates, so as to try to make the entire data set somewhat feasible with the actual yearly death experience at the ground level.
The chart is conservative on two fronts:
—the central estimate of 40 per 100,000 is low for an age group that goes up to age 39
—the error bars come from holding death counts to 99 (below the baseline deaths)
NOTE: The average share of deaths in each month from 2013-2019 served as the basis for the seasonality index
Reference
[monthly deaths in the UK to serve as baseline for seasonality index] — UN. https://data.un.org/Data.aspx?d=POP&f=tableCode:65