


New Phenomenon: Easily-Debunkable Doctor Claims
Evidence that the medical establishment is compromised
Note: An addendum to this Substack has been added here.
Over at the Substack
, there is this expose` about the authorities getting numbers wrong. One of the screenshots shared there is this tweet from a doctor: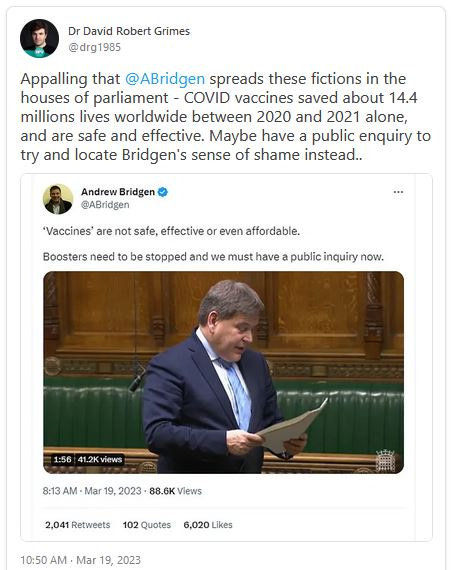
And yet it is very easily debunked. Using data from The Economist, you can get the total accumulation of world excess death by the week. Here is how it looks when graphed:
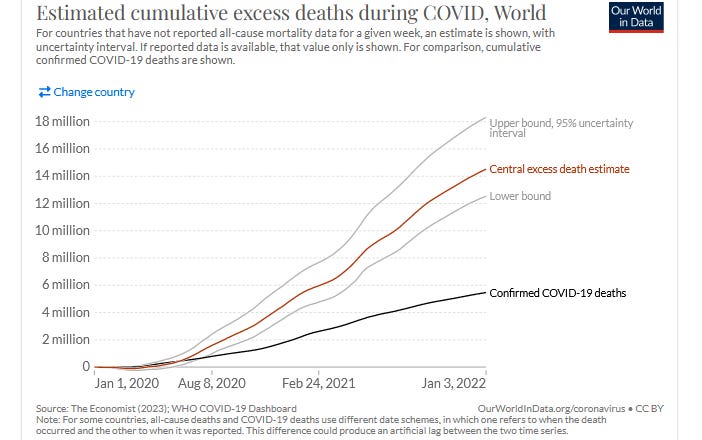
The date cutoff at right is 3 days past the stop-point mentioned by Dr. Grimes in that tweet claiming how “COVID vaccines” prevented 14.4 million deaths by the end of 2021. An interesting side-note is that there had not yet been 6 million confirmed COVID deaths by then.
The accumulation rates before and after COVID jab rollouts are the average upward slope of the line sections corresponding to those time windows. But the rate of accumulation of excess death after jab rollouts is over 50% higher than before them.
Before jabs rolled out, the average accumulation rate of excess death worldwide was 17,600 world excess deaths per day.
After jabs, the average accumulation rate of excess death worldwide was 26,400 world excess deaths per day (a 55% increase).
But according to Dr. Grimes, COVID was going to begin being 3.7 times as deadly as itself (~63,200 world excess deaths per day) when COVID jabs rolled out, yet it only became 1.55 times as deadly as itself (26,400 world excess deaths per day) — sparing 14.4 million lives in the process.
What would Dr. Grimes say if asked …
“How do you know that COVID was going to become 3.7 times more deadly than it had been from 6 Apr 2020 to 7 Dec 2020, when the average accumulation rate of excess death was just 17,600 per day?”
Dr. Grimes wouldn’t be able to answer the question about how it was going to be the case that COVID was going to become approximately 4 times more deadly, so that a relatively-smaller 55% increase in excess death rate would represent “lives saved.”
Here is how it looks when graphed:
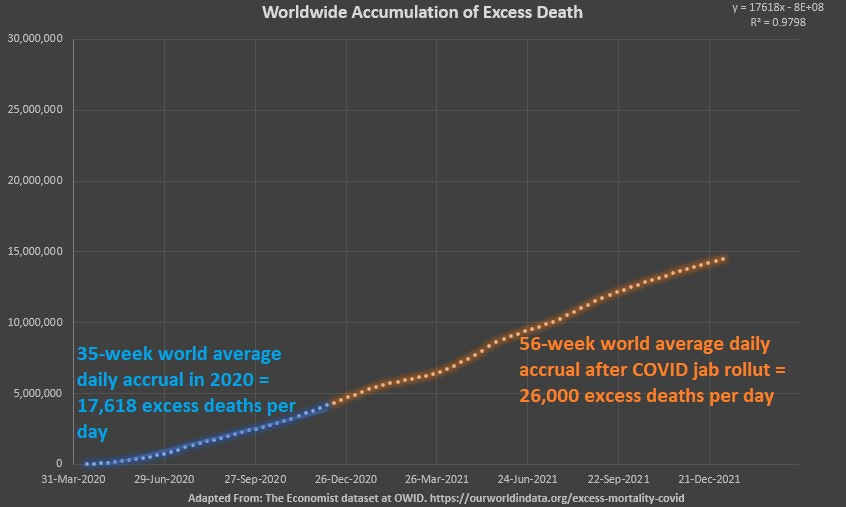
The blue dots at bottom left are weekly reports of the total accumulation of excess death worldwide from 6 Apr 2020 to 7 Dec 2020 — the time window when no COVID jab had yet rolled out (except for in Russia and China). The orange dots are the week of 14 Dec 2020 to the week of 3 Jan 2022.
And in the case where 14.4 million lives got saved, here is what is implied:
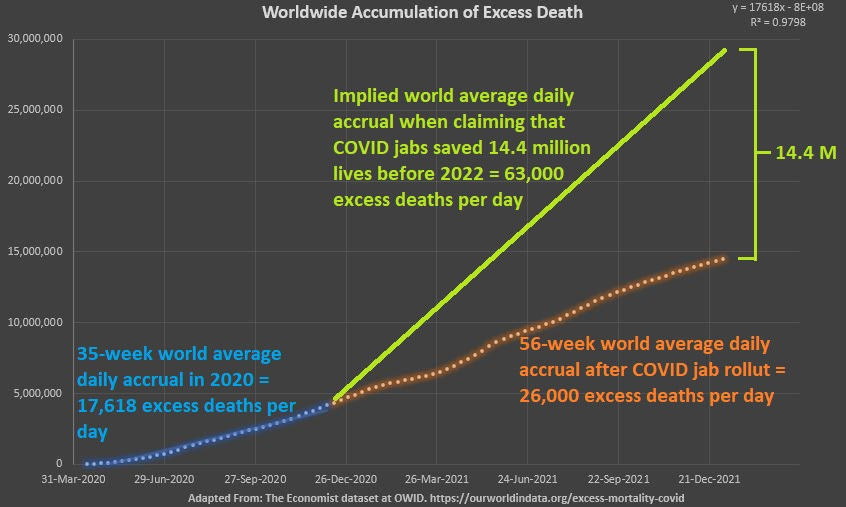
The lime green line has 3.7 times the slope of the blue section of excess death accrual under COVID alone (no COVID jab). But what bio-physical explanation can be given for a disease which all-of-a-sudden becomes 3.7 times as dangerous as itself?
Answer: None. There is no biophysical explanation for a disease becoming almost 4 times as dangerous overnight. Yet that is exactly what doctors such as Grimes need you to believe.
Given the rate of accrual of excess death before and after jabs, it is only by postulating a several-fold increase in lethality that you can justify the statement: COVID jabs saved 14.4 million lives.