Peak Weekly Excess Death (timing/magnitude)
Peak Weekly Excess Death (timing/magnitude)
Post #757

In this prior report, it was demonstrated that mortality is normative — that there are good death rates and bad death rates which would actually be deemed to be “too high” — which, being normative excess, is actually a separate and even more informative issue than statistical excess.
For 128 populations of the world, beginning at 1 Jan 2020 and looking forward in time, here are the dates and magnitudes of peak weekly percent excess death:
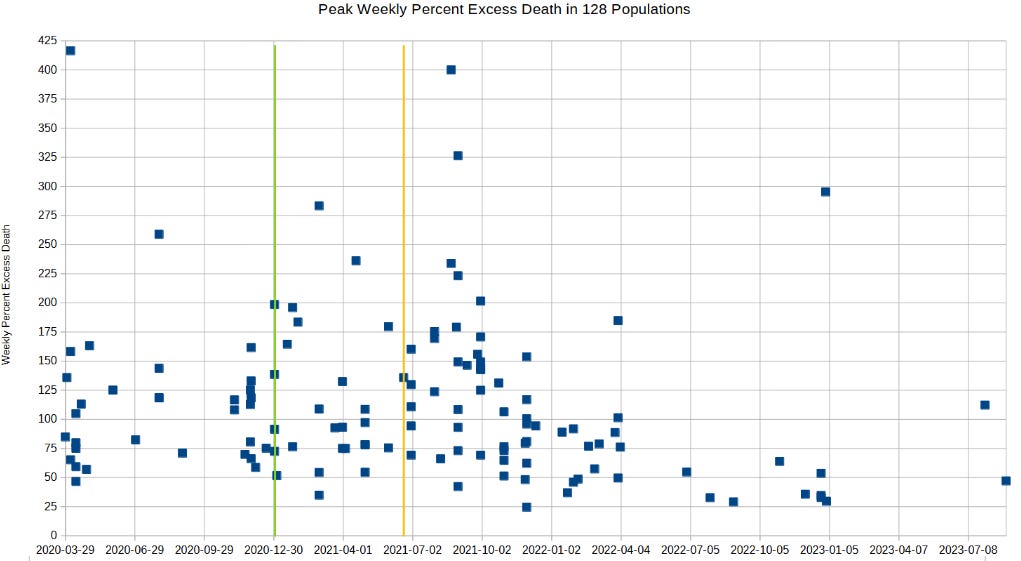
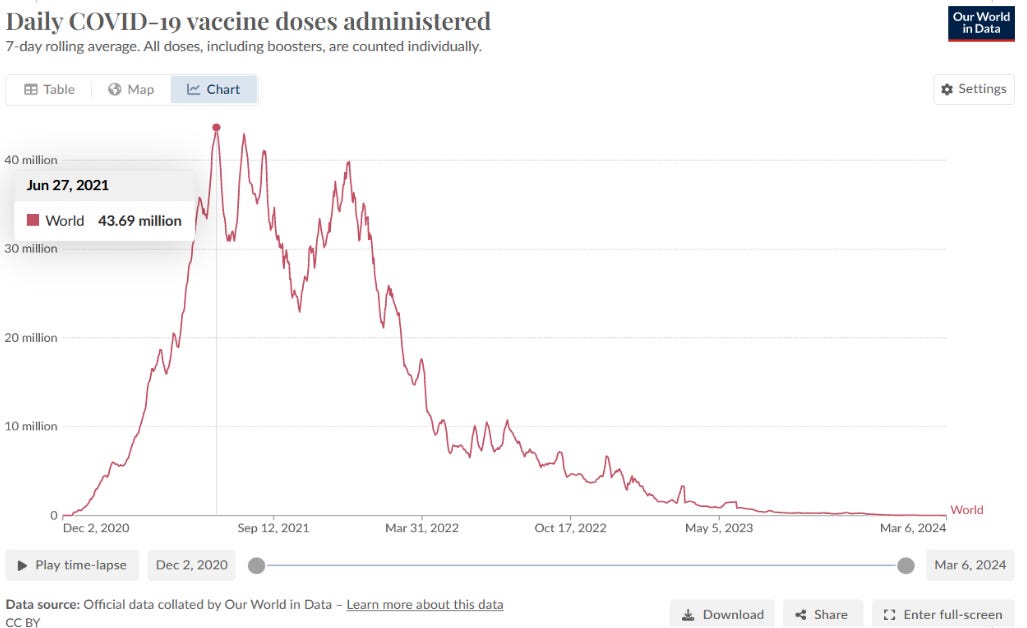
The green line indicates 30 Dec 2020, when most of the largest populations of the world had begun dosing with experimental COVID shots. The orange line indicates the world peak daily uptake of COVID shots, when the average daily uptake was 43.69 million recipients per day.
If official narratives held true, then the number of peaks of excess death on the right side of the orange line — after COVID shots reached peak administration levels — would be at least 50% lower than those on the left (when COVID shots had rolled out). But the actual count of excess death peaks prior is 59 vs. 69 excess peaks found after.
When put through a chi-squared goodness-of-fit test under the assumption that COVID shots should have been able to cut risk of death in half, the p-value was 0.001 — indicating that chances are 999 out of a thousand that shots did not “work” (that they did not reduce the risk of excess death).
Magnitude of excess will be discussed in a future installment.
Peak World Uptake of Experimental COVID shots