
Relation of Excess Death to Last 6 Months of Jabs
Post #692

When trying to explain the very high peaks in weekly excess death among nations, it might help to relate those death peaks to the peak uptake level of COVID shots. A testable hypothesis could be that the peak in “jab uptake of last 6 months” coincides with the peak in “weekly excess death.”
Or, more granular, you could say that having 100 doses per 100 people over the last 6 months leads to a peak in (or “very high”) excess death counts. Here is “peak excess death” for Australia:
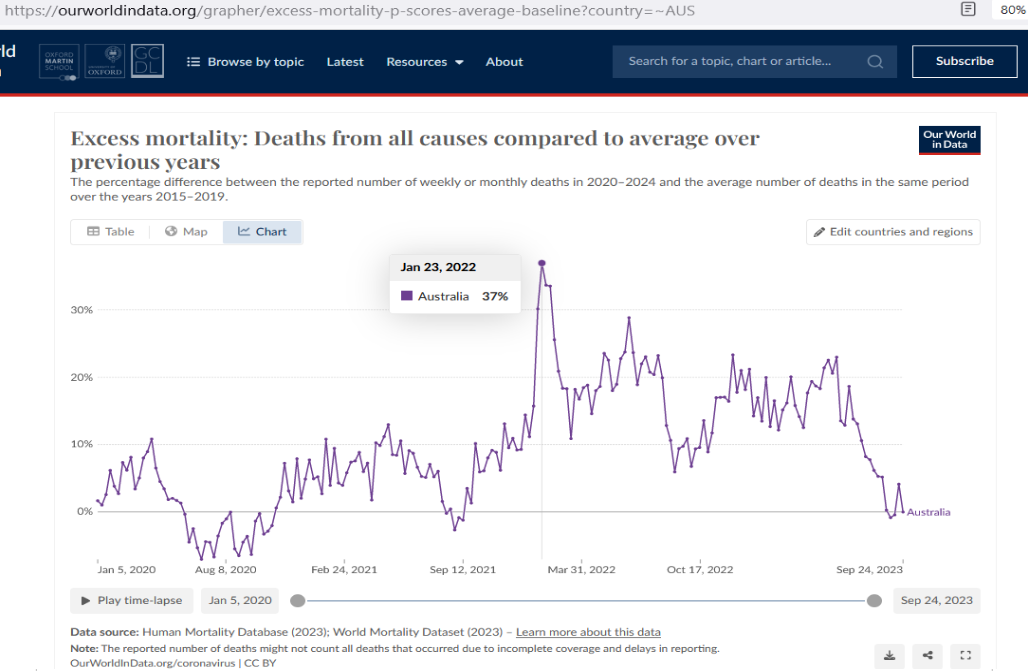
And here is how it looks against the background of expected weekly death counts:

And here is where that week including 23 Jan 2022 maps to on the curve of “uptake over last 6 months” (in other words, a 6-month COVID shot uptake rate, or a “6M-CSUR”, for short):

Notice how it is that the peak 6-month uptake level coincides with peak excess death. Also of note is the high value of 140 COVID shots per 100 people over the previous 6 months.
To attempt to confirm the temporal relationship between “high jab uptake” and “high excess death” — here is “peak excess death” in Thailand:

And here is how it looks against the background of expected monthly death counts:

Thailand’s peak excess death came earlier than Australia’s did. But most important is where their death peak fits into the curve of “COVID shot uptake rate”:

For Thailand, peak weekly excess death did not coincide with peak 6M-CSUR (6-month COVID shot uptake rate). But Thailand may be representative of a boundary case, such that a new and testable hypothesis could be:
“Peak excess death in most nations will be found to occur after each nation passes a threshold 6M-CSUR of 40 doses per 100 people over the prior 6 months.”
Having a hypothesis to test (after witnessing just 2 outcomes), I will begin collecting data on it and will report back on this later.
Addendum: The first tranche of data has been collected and analyzed here.