NOTE: The first report on ICAN’s aggregation of V-Safe data is here.
When looking at the more common, but serious, adverse events reported in the free text section of the V-Safe data, Herpes zoster (shingles) really stands out:
With 11,406 persons reporting shingles after COVID shots, from about 10 million persons total, that is approximately 1,140 reports of shingles per million persons exposed to COVID shots. The average number of COVID shots taken by those 10 million persons was about 2.05 when not accounting for attrition (loss to follow-up).
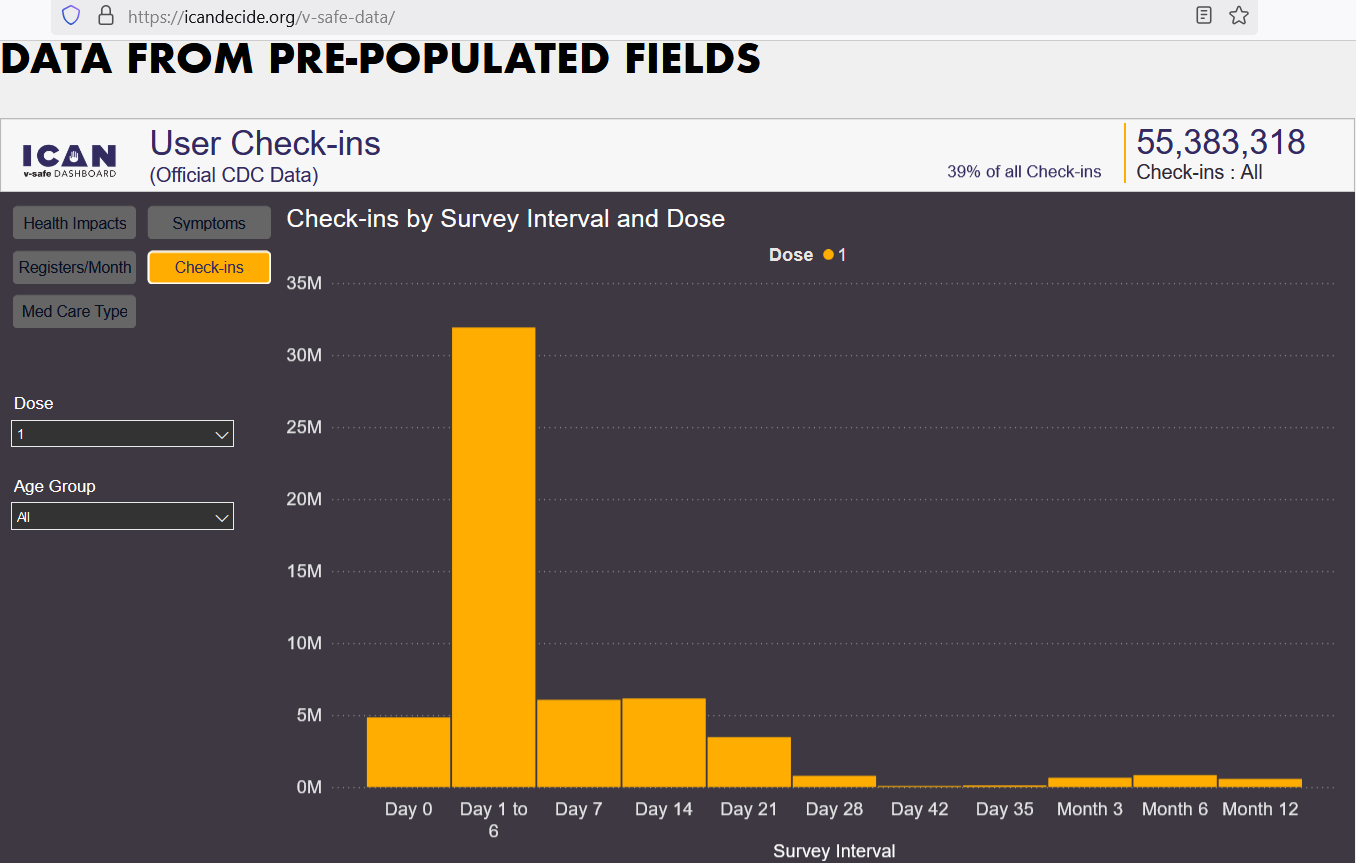
Assigning a 10% arbitrary attrition rate by dose (10% of people getting bored with participating in V-safe, or forgetting about it, or whatever), the weighted average only moves up to 2.19 doses per person. A general truism is that, on average, just over two doses per person went out to V-Safe participants. Here are the Dose 1 check-ins:
Though 10 million were involved, just over 6 million of them checked in on Day 7, and just over 6 million of them checked in on Day 14. Day 21 and Day 28 drop by a lot because these people are moving into the Dose 2 category for their next check-in. Here are the Dose 2 check-ins:
From Day 14 (Week 2) to Day 42 (Week 6), there were 518,000 (about 10%) lost to follow-up. Some may have gotten bored, or else they forgot to check in. Some who were alive at Week 2 may have died by Week 6. Not many people moved on to Dose 3 though:
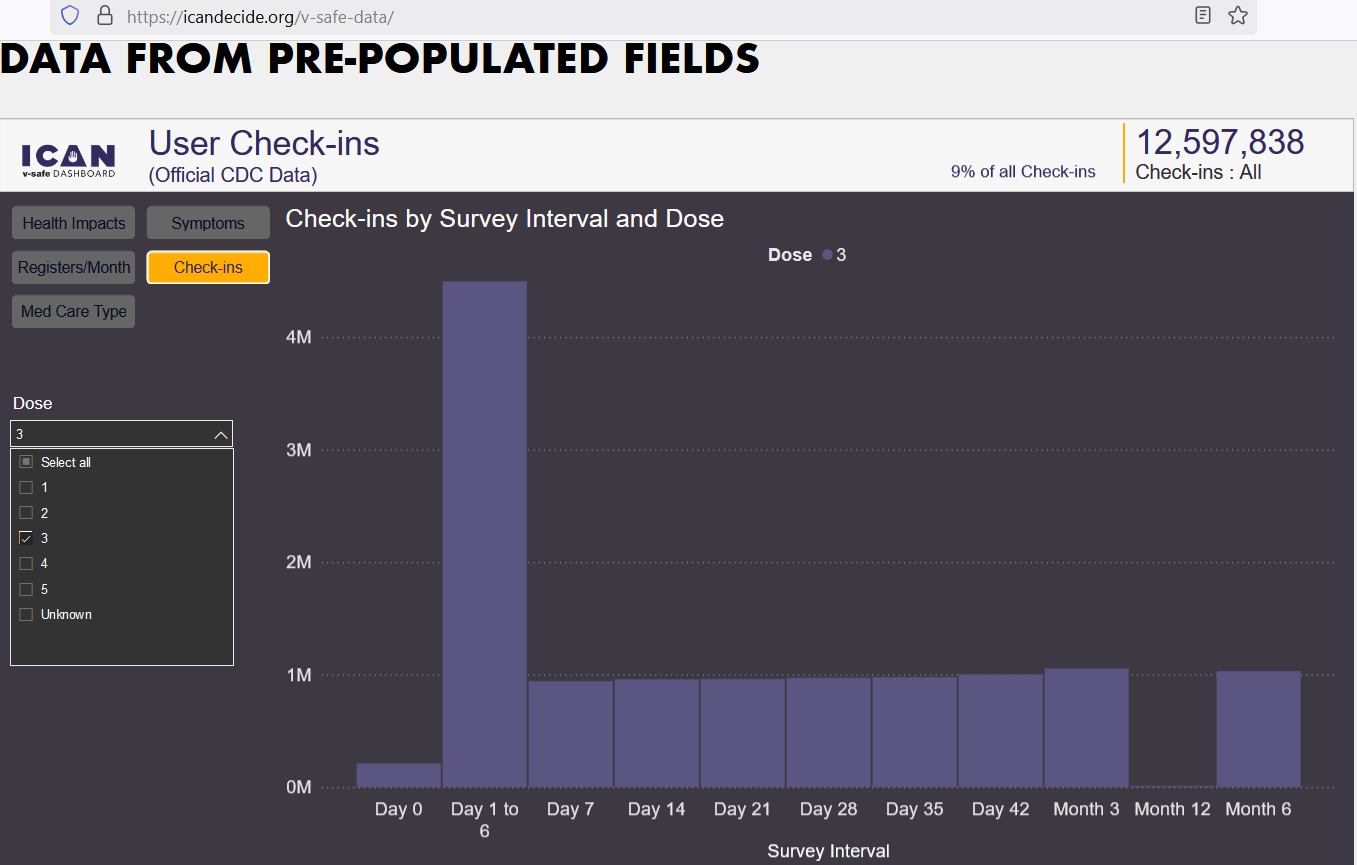
These numbers represent less than 20% of the original values. Moving to Dose 4 and Dose 5, you get the same exponential decay in the number of people moving on to the next dose. Here is Dose 4:
And here is Dose 5:
Just over 500 total people are checking in on Day 7 and on Day 14 in this final group. How different from the 5 million who were checking in on those days in Dose 2! But if 10 million people take an average of 2.19 doses per person (21.9 M doses), and it ends up leading to 11,406 cases of shingles, then that is 521 shingles cases per million doses.
Let’s compare that rate to the VAERS reporting rate typically found after flu shots:
Due to changes in the total number of flu shots given out per year, the year of 1993 — with 14 reports of shingles (herpes zoster) — has the highest rate from the years above: 0.3 reports of shingles per million doses of flu shots. But the COVID shot shingles rate was more than 1,000 times that rate, though further correction is needed.
To correct for the difference in the propensity to report between V-Safe (high propensity) and VAERS (low propensity), we can adjust the rate by a factor of three — such that, if 99% of all shingles cases are caught through the V-Safe system, then only 33% of the shingles cases will get caught if those same people had used only VAERS.
Under this assumption, we can increase the rate found through VAERS by a multiple of 3 in order to make it commensurable (comparable) to the rates found in V-Safe. We end up with 0.9 imputed shingles reports per million flu doses, compared to 521 shingles reports per million COVID shot doses — a difference of over 500x.
Even if we assume that V-Safe comes with a propensity to report that is 5 times larger than is true of the VAERS system — e.g., 95% of cases caught through V-Safe; but only 19% get caught through VAERS — then the VAERS reports bump up to 1.5 cases per million, but we do not even come close to closing the gap. We only get down to 347x.
But a rate ratio of 347-to-1 is a very strong safety signal.


