NOTE: This post has now undergone a substantial revision from the original.
In this prior report, it was shown that, after leading the world in mRNA uptake, Japan had an excess death rate 82% higher than the world average. There was not space in the last report for references, so they will be put here, along with crucial perspective in what the mRNA shots did to Japan. Here is Japan’s excess death under COVID (red line):
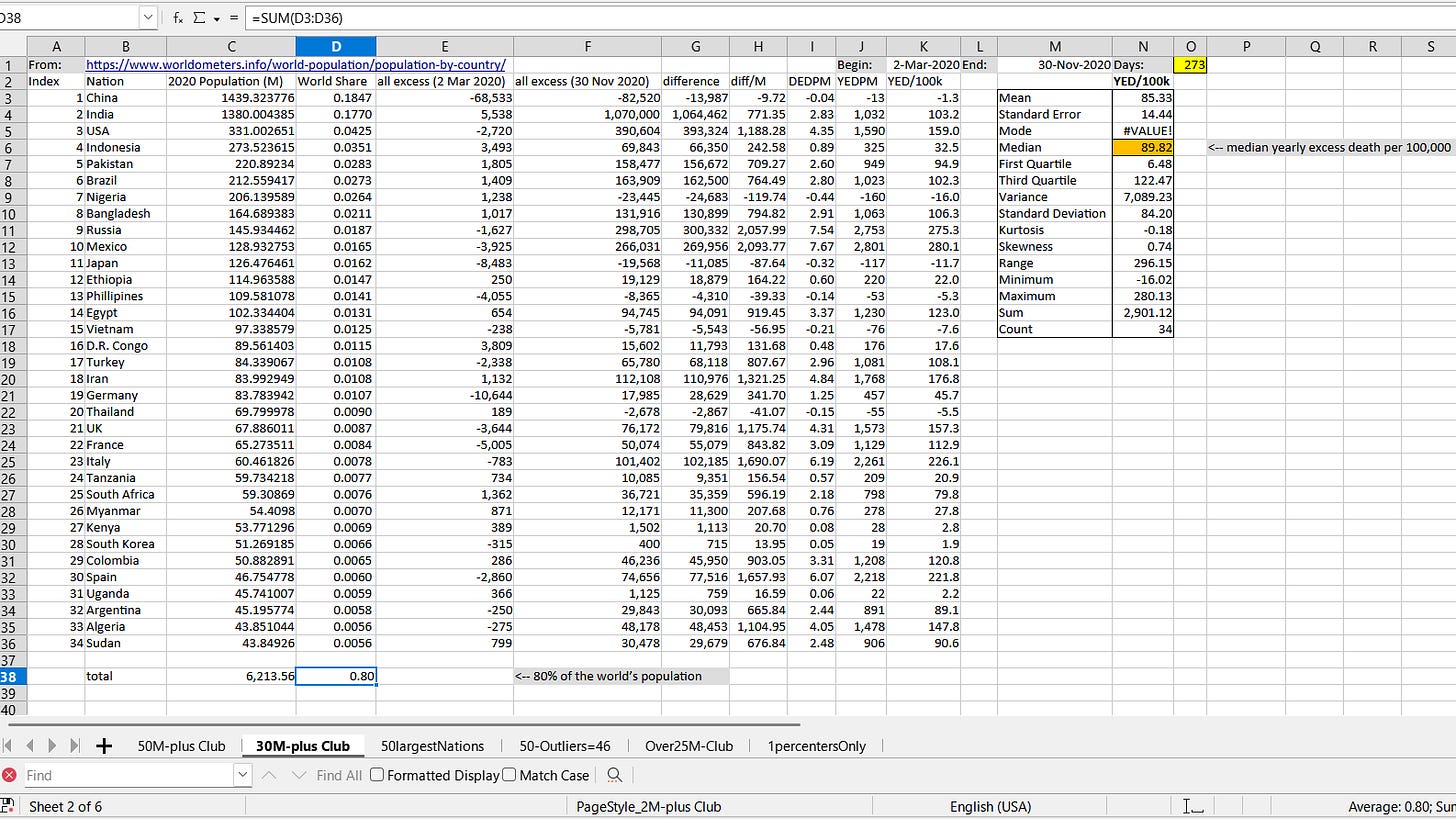
As is shown, deaths were below expectations in Japan, all throughout COVID prior to the COVID shot rollout. For contrast, I selected nations, largest to smallest, until the nations in the sample represented a full 80% of the world population. Then, I found the median yearly excess death rate per 100,000 prior to COVID shot rollouts:
{click to enlarge]
Cell D38 shows that these largest 34 nations harbor 80% of the world’s population. Cell N6 shows that, prior to the COVID shot rollout, the median yearly excess death per 100,000 was 90 (89.82). Five other situations will be added in the chart below for vital perspective on the excess death rate which followed Japan’s uptake of mRNA:
Beginning at left, we have little to no COVID excess death in Japan prior to mRNA shots. The next item is the flu season of 1998/99 in Japan. The third item is the severe flu season of 2017-2018 through all of Europe. The fourth is the 1957 Asian Flu in the USA. The fifth is US losses during World War II. The sixth is US losses during WWI.
The seventh shows the median pre-jab COVID excess death rate for 80% of the world.
Then you have Japan’s excess death rate, after having the world-highest uptake of mRNA shots. The evidence casts so much doubt on the safety of mRNA that it is baffling to still see any purportedly-competent health officials continuing to defend mRNA shots as being safe to take into your body.
Safe products don’t lead to higher excess death rates than are even found in war.
Reference
References for prior report:
[dose types] — https://ourworldindata.org/grapher/covid-vaccine-doses-by-manufacturer?country=~JPN
[dose uptake] — https://ourworldindata.org/covid-vaccinations
[accumulation of excess death per 100,000] — https://ourworldindata.org/coronavirus
[dose types in Cuba] — https://covid19.trackvaccines.org/country/cuba/
[typical excess death from flu in Japan is 32 per 100,000] — Shindo N. [Morbidity and mortality of influenza in Japan]. Nihon Rinsho. 2000 Nov;58(11):2187-91. Japanese. PMID: 11225302. https://pubmed.ncbi.nlm.nih.gov/11225302/
New References for this report:
[WWI Timeline] — https://www.loc.gov/collections/stars-and-stripes/articles-and-essays/a-world-at-war/timeline-1914-1921
[US losses in WWI] — https://www.census.gov/history/pdf/reperes112018.pdf [this link may now be broken]
In 1.6 years of fighting in WWI, the US lost 0.13% of its population:
[WWII losses for USA of 298,000 deaths during 3.7 years of fighting; when US population was 137.6 million] — Encyclopedia Britannica. https://www.britannica.com/event/World-War-II/Costs-of-the-war
[almost 70,000 died during the 1957 Asian Flu] — https://www2.nau.edu/gaud/bio302/content/pndmic.htm
[yearly excess death rate during the 2017/18 flu in Europe was 34 per 100,000] — Nielsen J, Vestergaard LS, Richter L, Schmid D, Bustos N, Asikainen T, Trebbien R, Denissov G, Innos K, Virtanen MJ, Fouillet A, Lytras T, Gkolfinopoulou K, Heiden MA, Grabenhenrich L, Uphoff H, Paldy A, Bobvos J, Domegan L, O'Donnell J, Scortichini M, de Martino A, Mossong J, England K, Melillo J, van Asten L, de Lange MM, Tønnessen R, White RA, da Silva SP, Rodrigues AP, Larrauri A, Mazagatos C, Farah A, Carnahan AD, Junker C, Sinnathamby M, Pebody RG, Andrews N, Reynolds A, McMenamin J, Brown CS, Adlhoch C, Penttinen P, Mølbak K, Krause TG. European all-cause excess and influenza-attributable mortality in the 2017/18 season: should the burden of influenza B be reconsidered? Clin Microbiol Infect. 2019 Oct;25(10):1266-1276. doi: 10.1016/j.cmi.2019.02.011. Epub 2019 Feb 18. PMID: 30790685. https://pubmed.ncbi.nlm.nih.gov/30790685/


