


A "Deadly-15" of Moderna Lots
Post #1196

NOTE: Edited to set average age of persons receiving flu shots (and final estimate)
In this previous installment, the reporting rate for blood clots from Moderna shots was compared to that from flu shots. Here, the respective reporting rates for fatal adverse event reports (fatal AERs) will be compared. Here is the search page for fatal AERs from Moderna lots, using the latest 28 Feb 2025 release of VAERS data:
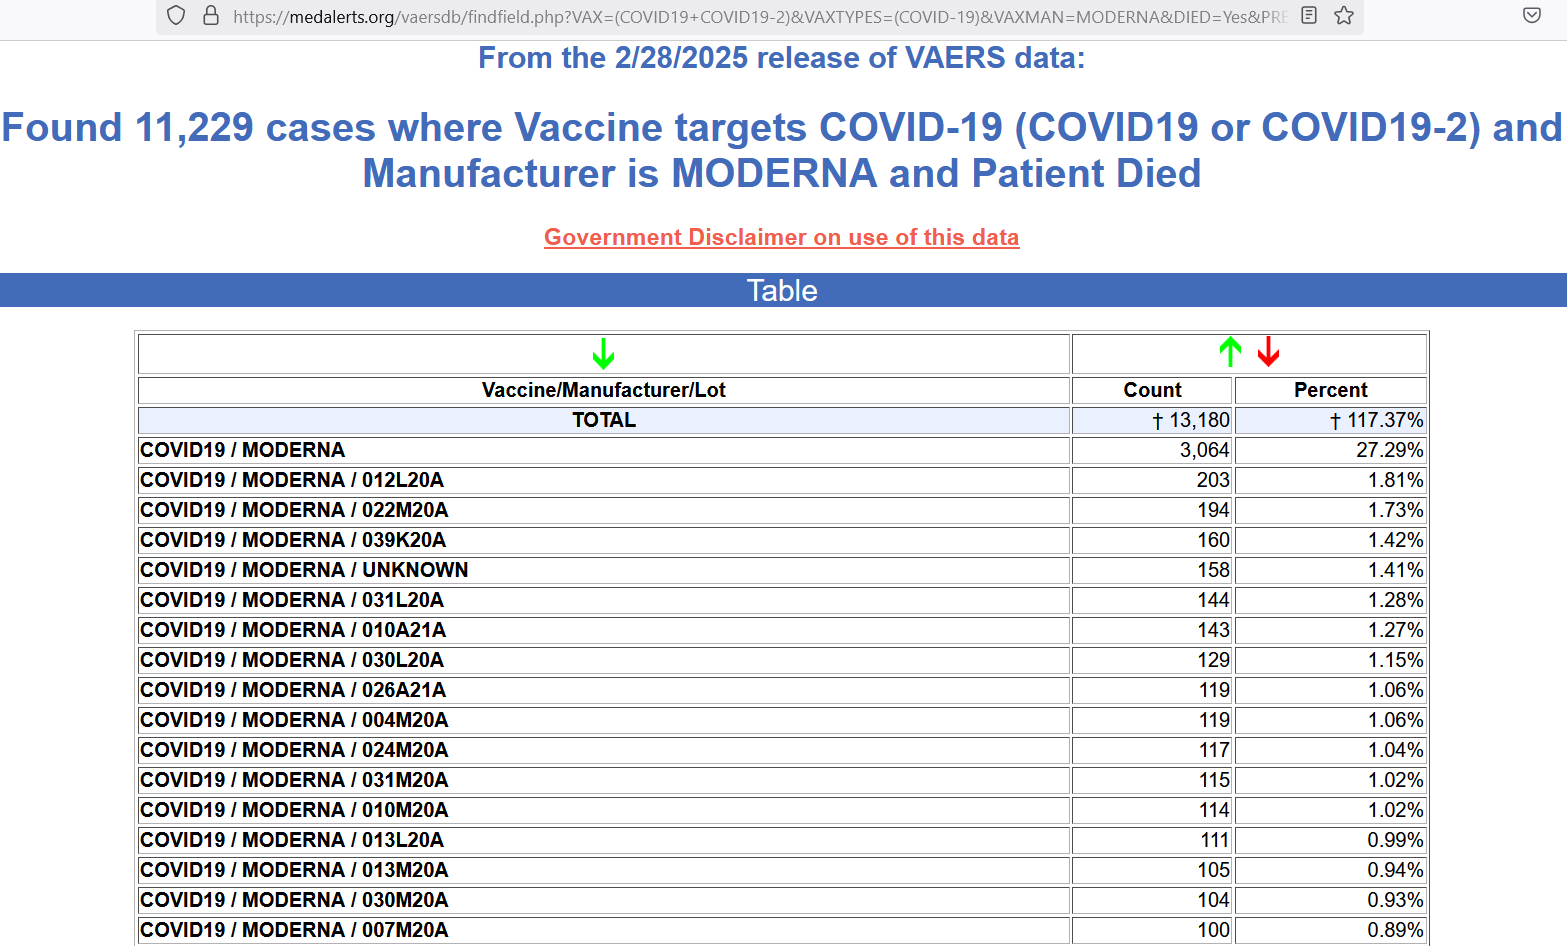
The count of fatal AERs for each lot shows up as being 100 or more, but the actual numbers are higher than what shows, due to variation in typographic entry of lot numbers (found further down the list). Here are the fatal AERs by month of injection with flu shots over a 10-year time window:

Note how the first season is the 2010/11 season and how the search page was looking from June 2010 forward — so as to cover all of the possible flu shot doses for the 2010/11 flu season (earliest = July). Counting stopped by June 2020, covering all of the possible flu shot doses for that final 2019/20 flu season.
Here is how each individual Moderna lot compared to the average reporting rate of fatal AERs for flu shots:

Moderna lot 012 L 20 A had the highest fatal AER reporting rate, with 175.4 fatal AERs per million doses. This led to a Moderna-to-flu-shot ratio of 842x. The best lot of the 15 was Moderna lot 013 M 20 A, with 75.4 fatal AERs per million doses, leading to a ratio of 362x. Here are the individual flu season rates compared to all Moderna:

The worst flu season was 2011/12, with 0.30 fatal AERs per million doses, and leading to a ratio of 356x — i.e., even when compared to the worst flu season of the last decade prior to COVID, Moderna lots had 356 times as many fatal AERs per million doses. Here are the notes used in order to build these charts:

[click to enlarge]
The worst reporting rates for fatal AERs per million doses are marked orange. Cell P18 is selected to show its formula up top and how that formula divides the Moderna average rate (cell D21) by the 2011/12 flu season rate (cell O13), obtaining the lowest estimate of the ratio of Moderna-to-flu shots:
356x
Because the age distribution of those receiving flu shots (mean age = 41) is somewhat lower than the age distribution of those receiving COVID shots (mean age = 54) — and 54 year-olds die at a rate that is about 2.4x the rate for 41 year-olds — the evidence suggests that these Moderna lots were approximately 148x more lethal than flu shots.
Reference
[ICAN page with a link to the 17Mb PDF file showing Moderna lot sizes] — https://icandecide.org/article/exclusive-moderna-lot-and-dose-data-release/
[seasonal uptake of flu shots] — CDC. https://www.cdc.gov/flu/hcp/vaccine-supply/vaccine-supply-historical.html
[MedAlerts VAERS searching tool] — MedAlerts. https://medalerts.org/vaersdb/index.php
[age distribution of those receiving flu shots in 2019/20] — https://www.cdc.gov/fluvaxview/coverage-by-season/vaccination-2019-2020.html
Adults:

Kids:

[mean of age distribution of elderly is 75.5] — https://www.census.gov/library/stories/2023/05/2020-census-united-states-older-population-grew.html
